Companies Home Search Profile

Visualizing Advanced Charts and Graphs

Focused View

Amy Balliett

2:12:37

26 View
  • 01 - Moving beyond basic data viz.mp4
    01:35
  • 02 - Do you need the basics first.mp4
    04:33
  • 01 - What makes a chart or graph advanced.mp4
    03:15
  • 02 - How the brain responds to data viz.mp4
    03:45
  • 03 - The chart selection framework.mp4
    03:14
  • 01 - What are distribution charts and graphs.mp4
    04:37
  • 02 - Density plots explained What, when, why, and how.mp4
    06:03
  • 03 - Ridgeline (joy) plots explained What, when, why and how.mp4
    04:38
  • 04 - Box plots explained What, when, why, and how.mp4
    05:39
  • 05 - Variations of box plots Violin plots and more.mp4
    04:36
  • 06 - Sankey diagrams explained What, when, why and how.mp4
    05:38
  • 01 - What are comparison charts and graphs.mp4
    02:24
  • 02 - Alluvial charts and parallel sets What, when, why, and how.mp4
    10:00
  • 03 - Bullet graphs explained What, when, why, and how.mp4
    08:35
  • 04 - Radial charts explained What, when, why, and how.mp4
    08:31
  • 05 - Radar charts explained What, when, why and how.mp4
    03:59
  • 06 - Coxcomb charts What, when, why and how.mp4
    04:58
  • 01 - What are relationship charts and graphs.mp4
    02:12
  • 02 - Parallel coordinates plots What, when, why, and how.mp4
    05:05
  • 03 - Chord diagrams explained What, when, why, and how.mp4
    09:31
  • 04 - Using maps for advanced data visualizations.mp4
    05:13
  • 01 - What are composition charts and graphs.mp4
    02:19
  • 02 - Marimekko charts explained What, when, why, and how.mp4
    07:31
  • 03 - Sunburst diagrams explained What, when, why, and how.mp4
    05:25
  • 04 - Streamgraphs explained What, when, why, and how.mp4
    06:35
  • 01 - Continuing to hone your advanced data visualization skills.mp4
    02:46
  • Description


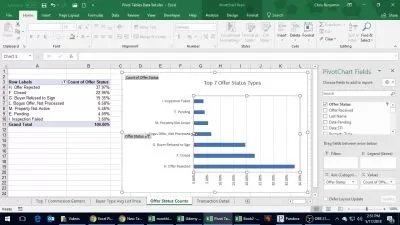
    Visualizing data sets as charts and graphs can do wonders to communicate complex business needs, depict underlying patterns, and make data trends crystal clear. But you need to develop your understanding of the many types of visualization elements that exist—and when and how to use which to be most effective. In this course, join designer and infographics expert Amy Balliett as she takes a deep dive into next-level data visualization strategies with advanced charts and graphs.

    Learn how our brains respond to data visualization to inform your selection strategy. Amy covers various types of charts and graphs, offering advice and tips for how to render them effectively to represent distribution, comparison, relationships, and composition. Discover how to use visualizations such as plots, Sankey diagrams, alluvial charts, parallel sets, bullet graphs, radial charts, Coxcomb charts, coordinate plots, chord diagrams, maps, Marimekko charts, streamgraphs, and more.

    More details


    User Reviews
    Rating
    0
    0
    0
    0
    0
    average 0
    Total votes0
    Focused display
    Amy Balliett
    Amy Balliett
    Instructor's Courses
    Amy Balliett made a name for herself as the CEO and Founder of the creative content agency, Killer Visual Strategies (formerly Killer Infographics). A seasoned entrepreneur, she owned her first company—a candy store and ice cream parlor—at the age of 17 before heading off for college. She subsequently built a successful career in film and marketing before launching Killer in 2010. Within a few years, Killer Visual Strategies grew to become the industry leader in visual communication, driving visual strategy and creative content campaigns for global brands including Microsoft, Boeing, Adobe, Nikon, Starbucks, the National Endowment for the Arts, the United Nations, and more. By 2018, Balliett and her executive team sold Killer to an agency collaborative and subsequently joined fellow agency leaders in building Material. Named the Number One Global Strategic Consulting Firm by GRIT in 2021, Material combines the talent of 12 leading agencies, consisting of 1200+ global employees across the practices of research, strategy, design, and brand building. Today, Balliett is the Senior Fellow of Visual Strategy for Material, serves as the Chief Visual Strategist on several boards, and is an award winning author. Considered an expert in her field, Balliett speaks at dozens of conferences each year including SXSW, Adobe MAX, Content Marketing World, and more. She is also a regular teacher at The School of Visual Concepts, a guest lecturer at several colleges and universities, and a LinkedIn Learning instructor.
    LinkedIn Learning is an American online learning provider. It provides video courses taught by industry experts in software, creative, and business skills. It is a subsidiary of LinkedIn. All the courses on LinkedIn fall into four categories: Business, Creative, Technology and Certifications. It was founded in 1995 by Lynda Weinman as Lynda.com before being acquired by LinkedIn in 2015. Microsoft acquired LinkedIn in December 2016.
    • language english
    • Training sessions 26
    • duration 2:12:37
    • English subtitles has
    • Release Date 2023/12/13