About Excel ChartsLearn More
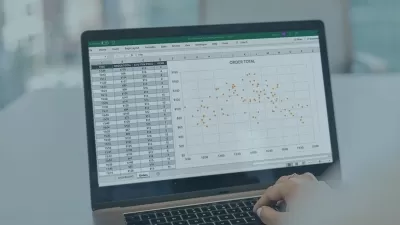
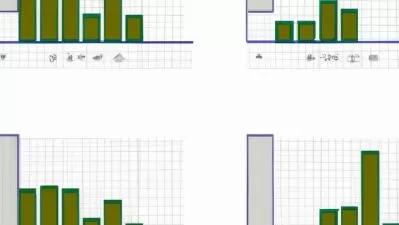
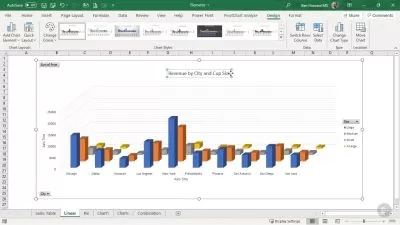
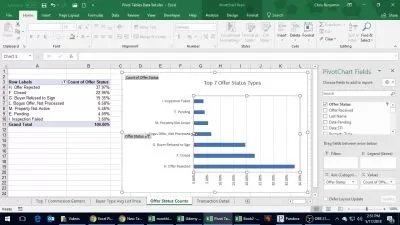
Charts and graphs help to make a visual effect of the data in the Excel file. The terms diagram and graph are generally used together and sometimes interchangeably. In general, graph can be considered as the most basic method for visual display of data that displays data values in a time period. Charts have a more complex structure and somehow make it easier to compare two types of data.
Sort by:
Sorting
The newest
Most visited
Course time
Subtitle
Filtering
Courses


Subtitle
SkillShareThe Complete Excel Course Pivot Tables, Charts & Dashboards
1:23:13
English subtitles
02/12/2024
Subtitle


Subtitle

Linkedin Learning

Amy Balliett
Visualizing Advanced Charts and Graphs 2:12:37
English subtitles
12/05/2023