Using plt.scatter() to Visualize Data in Python
Darren Jones
31:34
Description
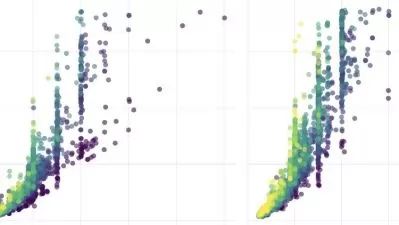
An important part of working with data is being able to visualize it. Python has several third-party modules you can use for data visualization. One of the most popular modules is Matplotlib and its submodule pyplot, often referred to using the alias plt. Matplotlib provides a very versatile tool called plt.scatter() that allows you to create both basic and more complex scatter plots.
What You'll Learn?
- Create a scatter plot using
plt.scatter() - Use the required and optional input parameters
- Customize scatter plots for basic and more advanced plots
- Represent more than two dimensions on a scatter plot
More details
User Reviews
Rating

Darren Jones
Instructor's CoursesDarren is an avid Pythonista and creates video tutorials for Real Python. Having followed a varied career as a nuclear industry instrumentation engineer, a musician, recording engineer and teacher, he’s always been interested in computers, spending the last 20 years producing music with them and teaching music technology. He’s written books on the subject, and spends the remainder of his time improving his Python skills, with a view to bringing them into the studio and classroom for better understanding of both music and programming.

Real Python
View courses Real Python- language english
- Training sessions 11
- duration 31:34
- Release Date 2023/01/05