

About Data VisualizationLearn More
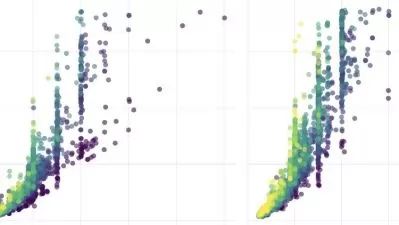
Statistics alone can fall flat. That’s why data visualization is so important to communicating the meaning behind data sets. Good visualizations can magically transform complex data analysis into appealing and easily understood representations that in turn inform smarter, more calculated business moves.
Sort by:
Sorting
The newest
Most visited
Course time
Subtitle
Filtering
Courses


Subtitle

Linkedin Learning

Jess Ingrassellino
InfluxDB for Time Series Data: Ingest, Analyze, and Visualize Data 1:08:45
English subtitles
09/17/2024
Subtitle

Linkedin Learning

Steve Wexler
How to Use Data Visualization to Make Better Decisions—Faster 51:04
English subtitles
09/11/2024


Books


Frequently asked questions about Data Visualization
Data visualization is the graphical representation of information and data. It is a storytelling tool that provides a way to communicate the meaning behind a data set. Simply put, data visualization helps users — the individuals or teams who generate the data, and in many cases, their audience — make sense of data and make the best data-driven decisions. Good visualizations can magically transform complex data analysis into appealing and easily understood representations that, in turn, inform smarter, more calculated business moves. Using visual elements like charts, graphs, and maps, data visualization tools provide an accessible way to see and understand trends, outliers, and patterns in data.
There are a variety of popular data visualization tools used by professionals in a variety of settings and at all levels. Some of the most widely utilized platforms include Microsoft Excel, Tableau, Python, and R; Udemy offers courses that can get you up to speed on all of these platforms. It’s important to note that dozens of data visualization tools are free and/or open-source, which means that the software’s original source code is freely available and can be distributed by anyone. Some tools, such as Power BI and Tableau, are free but not open-source, offering a free license but limited functionality. In addition, there are also modules or packages for open-source programming languages such as Matplotlib for Python and D3.jf, Plotly, and Chart.js for JavaScript. Lastly, there are niche tools such as Leaflet and OpenLayers for interactive mapping.
While there are specific careers that require data visualization skills, such as data scientist, data engineer, and business intelligence analyst, many industries require these skills to succeed and drive profit. In today’s data-driven world, it’s wise for professionals from all walks of life to have basic data visualization skills. For example, in the financial services sector, data visualization skills are critical when it comes to understanding finance data. Today’s journalists can also make great use of data visualization tools for quickly processing raw data, interpreting statistics, and improving their storytelling capabilities. Across all business sectors, more and more companies are figuring out how important it is to be able to converse with data and the role it plays in their success.
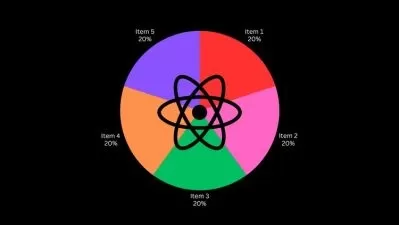
There are many ways to interpret data and tell a story visually. Some of the most common examples include charts (area, bar, and pie), tables (highlight and text), graphs (bullet and wedge stack), and maps (dot distribution and heat), as well as dashboards, histograms, and other infographics. You can create all of these using software such as Excel and Tableau. Selecting the correct visualization depends on the type of data you need to interpret: categorical, which describes categories or groups, or numerical, representing numbers. Udemy offers a variety of courses that teach you how to create impactful data visualizations and drive action with data-driven decisions.
Business analytics is the process of transforming the raw data businesses collect on their customers, performance, and the marketplace into applicable models so they can make informed decisions. It is an iterative, systematic, and statistical exploration of a company’s data to improve its operation or profitability. Business analytics is divided into three primary categories: descriptive, predictive, and prescriptive. Descriptive analytics uses historical data to answer the questions “what happened” or “what is happening.” Predictive analytics uses historical data to try to predict future outcomes. Prescriptive analytics combines the other two. It uses historical data to offer insights into what happened and then predict what will happen when it occurs and why. For example, a Las Vegas casino with an extensive buffet can use prescriptive analytics to determine when the most customers will want to eat and when staff should start preparing the food to have it ready on time.