The Complete Data Analysis and Visualization in Python 2023
Gulmira Iskendirova
3:34:04
Description
Learn Python libraries: NumPy, Pandas, Matplotlib and Seaborn for data analysis and visualization
What You'll Learn?
- Python's different libraries: NumPy, Pandas, Matplotlib, Seaborn
- scatter plot, bar plot, lmplot, lineplot, displot, boxplot, violinplot, pie chart and many others
- Data preprocessing using Pandas
- Jupyter Notebook
- Seaborn
- Reviewing basic statistics
- Exploratory Data Analysis
- Data Analysis on Netflix dataset, Diamond dataset, Test Score dataset
Who is this for?
What You Need to Know?
More details
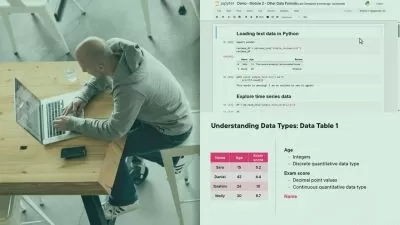
DescriptionIn this course, you will learn Python libraries from scratch. So, if you don’t have coding experience, that is very fine.
NumPy and Pandas are necessary libraries to do data analysis and preprocessing. In these course, most important concepts will be covered and after completing Pandas lectures, you will do Data Analysis exercise using Pandas for test score dataset. This is important step and aims to polish up your data preprocessing skill.
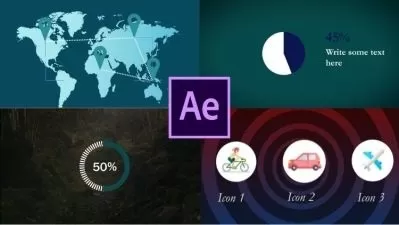
Then, we will learn Matplotlib which is fundamental package for data visualization. In these lectures, we will learn all necessary concepts for data visualization.
After, we will dive into Seaborn, statistical package with beautiful charts. First we will explore most important and used charts using Seaborn’s built-in dataset - tips. After completing these lectures, we will dive into full data analysis and visualization exercise using complex datasets.
Our first full data analysis exercise will be done using Netflix dataset where you will see how to do complex data preprocessing and applying Matplotlib functions to draw charts on progression and history.
For second data analysis, dataset about diamond was used where you will explore Seaborn’s full possibility.
After completing this course, you will learn not only how to do everything correct statistically, but also common mistakes people often do during their analysis work.
Who this course is for:
- Everyone interested in data analytics and data science
- Business Professional interested in data visualization
- Data analysis in Python
- Data visualization in Python
- Learning Pandas from scratch
- Preprocessing of data
- Learning Seaborn
In this course, you will learn Python libraries from scratch. So, if you don’t have coding experience, that is very fine.
NumPy and Pandas are necessary libraries to do data analysis and preprocessing. In these course, most important concepts will be covered and after completing Pandas lectures, you will do Data Analysis exercise using Pandas for test score dataset. This is important step and aims to polish up your data preprocessing skill.
Then, we will learn Matplotlib which is fundamental package for data visualization. In these lectures, we will learn all necessary concepts for data visualization.
After, we will dive into Seaborn, statistical package with beautiful charts. First we will explore most important and used charts using Seaborn’s built-in dataset - tips. After completing these lectures, we will dive into full data analysis and visualization exercise using complex datasets.
Our first full data analysis exercise will be done using Netflix dataset where you will see how to do complex data preprocessing and applying Matplotlib functions to draw charts on progression and history.
For second data analysis, dataset about diamond was used where you will explore Seaborn’s full possibility.
After completing this course, you will learn not only how to do everything correct statistically, but also common mistakes people often do during their analysis work.
Who this course is for:
- Everyone interested in data analytics and data science
- Business Professional interested in data visualization
- Data analysis in Python
- Data visualization in Python
- Learning Pandas from scratch
- Preprocessing of data
- Learning Seaborn
User Reviews
Rating

Gulmira Iskendirova
Instructor's Courses
Udemy
View courses Udemy- language english
- Training sessions 39
- duration 3:34:04
- Release Date 2023/11/14