

About StatisticsLearn More
Statistics is the mathematical discipline of gathering and analyzing data to determine probabilities. Information that statistical analysis provides influences markets, informs business decisions, and helps form government policy. An online statistics course teaches methods and models to enrich your data analysis skill set.
Sort by:
Sorting
The newest
Most visited
Course time
Subtitle
Filtering
Courses


Udemy

EDUCBA Bridging the Gap
Minitab Mastery: Statistical Analysis and Data Visualization 36:43:58
07/27/2024


Subtitle

Linkedin Learning

Wolfram Research
Wavelet Analysis: Concepts with Wolfram Language 49:09
English subtitles
03/28/2024
Subtitle

Linkedin Learning
Wolfram Research
Wavelet Analysis: Applications with Wolfram Language 51:36
English subtitles
03/28/2024
Subtitle
Linkedin Learning
Wolfram Research
Statistical Analysis with Wolfram Language 1:39:25
English subtitles
03/28/2024


Books


Frequently asked questions about Statistics
Statistics is an important decision-making tool in the everyday world. It represents the branch of applied mathematics concerned with collecting, analyzing, interpreting, and presenting empirical data. Empirical data involves the facts and figures assembled and used to answer questions about a group. Statistics relies on the theory of mathematical and computational tools to infer conclusions from qualitative and quantitative data. Qualitative data provides names or labels for categories of similar items—quantitative data measures how much of something there is. Characteristics of individual members of a group are the variables of the study. Statistical methods focus on concluding large groups, called populations, based on information obtained from observations made in small samples from that population.
The two major types of statistics are descriptive and inferential statistics. Descriptive statistics characterize the properties of data obtained from a study group sample. The sample represents a subset of the population while the population involves the entire group in making inferences. Inferential statistics uses the sample properties to test hypotheses and make conclusions. Descriptive statistics help understand complex quantitative information more simply, while inferential statistics provide data descriptions and draw inferences and conclusions from that data. Together, these types of statistics are important because they provide a method of understanding the characteristics of a small group as it relates to a larger population. They are also useful for learning about a large population without having to gather data from the entire group.
Statistics applies to various jobs in different fields, mostly collecting and analyzing information from myriad sources. For example, in business, a data analyst will collect and perform statistical analyses on data to help organizations understand how to make better business decisions. A data engineer designs, implements, and maintains software systems. In health care, for example, you would utilize statistics if you are a physician who wants to track the success of a new treatment. A nurse might keep track of a patient’s vital signs over a day or night. In public health, you might work as a health statistician for a health department that needs to track health data on several patients in a clinical trial. In the field of science, you would use statistics if you work as a chemist and need to measure the effects of a chemical compound. A biologist might use statistics to understand the characteristics of an animal population.
Probability represents the area of mathematics that deals with uncertain events. Any measurement or data collection is affected by different sources of variation. That means that repeating a measurement in an experiment could result in a different outcome. Probability attempts to understand or control these sources of variability. Calculation of probability may be for independent events or when two events are related. Independent events mean that the probability of one event occurring does not depend on another event happening. The probability of an event is a numerical measurement of the likelihood of its occurrence. Probability measures range between 0 and 1. That is the percentage of the time that the event will happen. For example, the probability of getting heads when you flip a coin is .5, meaning that half the time you will get heads, and half the time you will get tails. Understanding the likelihood of an event aids in making predictions regarding its occurrence.
Major applications of statistics today include areas like business analytics that build statistical models to assist business professionals in examining data from past business performance to understand the current market and predict future business trends. Data analysis relies on modeling statistical data to gain information used in decision-making. The field of data science uses statistical methods to gain knowledge from data, including applications in data mining and big data. Machine learning utilizes data to develop computer algorithms to build statistical models that can be used in applications for artificial intelligence or speech recognition. Data mining uses statistics to discover patterns in large sets of data. Another area is data visualization that deals with the graphic representation of data to assist with understanding complex relationships in a simpler form.
A normal distribution is the most common continuous statistical distribution. It is a probability function that describes how a set of values get distributed or spread out. This bell-shaped curve represents the probabilities for a distribution with a mean of zero and a standard deviation of one. Most of the observations get gathered around this center, while other values will spread out equally. More likely, events will fall closer to the middle, while less likely occurrences will lie toward the tails of this distribution. The relevance of the normal distribution in statistics frequently occurs in daily life, and many natural phenomena fit this distribution. Parameters like height and weight follow this distribution. Knowing the characteristics of the normal distribution allows for making inferences about the population in question and predicting where a member of a sample will fall along this curve.
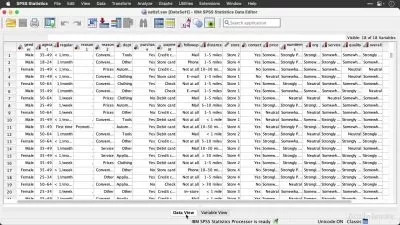
Excel offers a powerful way to analyze data contained in spreadsheets. It does this through data visualization and simple statistics to create graphics and with a Pivot table to create an aggregate of individual items in a spreadsheet. Python is a general purpose, high-level programming language that is often used for data mining and visualization. Its simple syntax makes it easy to learn and use in various statistical applications. SPSS is a frequently used statistical software in behavioral research that compiles descriptive statistics and graphical representations for advanced statistical analysis. Machine learning is a powerful tool that can be used to develop computer algorithms that can improve through experience with additional data to make predictions and decisions automatically and can be used in fields like medicine or computer science for developing artificial intelligence.
Bayesian statistics is a mathematical procedure that applies probability theory to statistical problems. It relies on conditional probability using the information to determine the likelihood of an event’s occurrence. Bayesian statistics update our beliefs when presented with evidence from new data and eliminates mistakes in our decisions. It uses A/B testing, which analyzes the performance of two groups to determine which is performing better and allows for leveraging multiple sources of data. Bayesian statistics relates a calculated quantity to one that can answer arbitrary questions-- used with a complex model with many measurement errors or multiple data sources. That is essential in marketing to determine which sales technique remains more effective. An example of this determines which internet page creates more sales of a product or service and permits effective webpage design to increase sales.