Spotfire - The Complete TIBCO Spotfire Course
George Smarts
2:44:39
Description
Become a TIBCO Cloud Spotfire expert. Learn how to create amazing dashboards using the latest version of Spotfire
What You'll Learn?
- Connect to data to TIBCO Spotfire
- Create calculated fields
- Create professional dashboards
- Create amazing visualizations
- Sort, filter, slice, pivot and graph your data using TIBCO Spotfire
- Map your data for greographic variation trend analysis
- Learn visualization best practices
- Learn tips and tricks from the BI industry
Who is this for?
What You Need to Know?
More details
DescriptionWelcome to the bestselling and most comprehensive course on TIBCOÂ Spotfire
You'll learn all of the features in TIBCOÂ Spotfire that allow you to explore, present and analyze data in a professional way. The course will go step by step from connecting your data, creating multiple visualizations, cover what are the best practices are, cover all the tips and tricks you need to know and finally we will publish the dasbhoards that we create.
Use TIBCOÂ Spotfire to Analyze and Visualize Data in Dashbaords like a PRO
Connect TIBCOÂ Spotfire to a Variety of Datasets
Analyze, Blend, Join, and Calculate Data
Visualize Data in the Form of Various Charts, Plots, and Maps
Contents and Overview
This course begins with TIBCOÂ Spotfire basics. You will begin by installing the software, exploring the interface, connect it to a data file and going over some of the basic functionality.
In order to become an expert in visualizing data wtih Spotfire, you'll cover how to create various charts, maps, scatterplots, and interactive dashboards for each of your projects.
Then, you'll proceed to cover the latest and most advanced features in TIBCOÂ Spotfire. By the time you complete this course, you'll be a highly proficient TIBCOÂ Spotfire analyst.
Here are some of the topics we will cover:
Connect to a data source from Spotfire
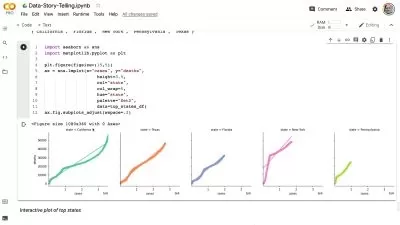
Visualizations - how to create Bar chart, Line chart, Pie chart, Scatter plot, Map chart, Treemap, KPI chart, Heat map and more
How to create efficient drill downs
How to create Control Panels
How to use Filtering, the Find tool, Conversations, Bookmars and Annotations
How to use the Trellis functionality
How to use the Dava Canvas within TIBCO Spotfire
How to export and publish your dashboards
and much much more!
Enroll today and enjoy:
Lifetime access to the course
3 hours of high quality, up to date video lectures
Practical Spotfire course with step by step instructions on how to implement the different features
Who this course is for:
- You should take this course if want to learn TIBCOÂ Spotfire completely from scratch
- You should take this course if you know the basic features of Spotfire but want to learn more tips and tricks
Welcome to the bestselling and most comprehensive course on TIBCOÂ Spotfire
You'll learn all of the features in TIBCOÂ Spotfire that allow you to explore, present and analyze data in a professional way. The course will go step by step from connecting your data, creating multiple visualizations, cover what are the best practices are, cover all the tips and tricks you need to know and finally we will publish the dasbhoards that we create.
Use TIBCOÂ Spotfire to Analyze and Visualize Data in Dashbaords like a PRO
Connect TIBCOÂ Spotfire to a Variety of Datasets
Analyze, Blend, Join, and Calculate Data
Visualize Data in the Form of Various Charts, Plots, and Maps
Contents and Overview
This course begins with TIBCOÂ Spotfire basics. You will begin by installing the software, exploring the interface, connect it to a data file and going over some of the basic functionality.
In order to become an expert in visualizing data wtih Spotfire, you'll cover how to create various charts, maps, scatterplots, and interactive dashboards for each of your projects.
Then, you'll proceed to cover the latest and most advanced features in TIBCOÂ Spotfire. By the time you complete this course, you'll be a highly proficient TIBCOÂ Spotfire analyst.
Here are some of the topics we will cover:
Connect to a data source from Spotfire
Visualizations - how to create Bar chart, Line chart, Pie chart, Scatter plot, Map chart, Treemap, KPI chart, Heat map and more
How to create efficient drill downs
How to create Control Panels
How to use Filtering, the Find tool, Conversations, Bookmars and Annotations
How to use the Trellis functionality
How to use the Dava Canvas within TIBCO Spotfire
How to export and publish your dashboards
and much much more!
Enroll today and enjoy:
Lifetime access to the course
3 hours of high quality, up to date video lectures
Practical Spotfire course with step by step instructions on how to implement the different features
Who this course is for:
- You should take this course if want to learn TIBCOÂ Spotfire completely from scratch
- You should take this course if you know the basic features of Spotfire but want to learn more tips and tricks
User Reviews
Rating
George Smarts
Instructor's Courses
Udemy
View courses Udemy- language english
- Training sessions 34
- duration 2:44:39
- English subtitles has
- Release Date 2024/04/29


