Power BI : Your Journey to Data Visualization Excellence
Rajat Eklare
12:06:36
Description
Power BI: Your Guide to Stunning Data Dashboards
What You'll Learn?
- Master Power BI Interface: Navigate through Power BI's user-friendly interface with confidence and ease.
- Data Transformation: Learn to clean, transform, and shape data to make it ready for visualization.
- Create Interactive Visuals: Build stunning interactive charts, graphs, and dashboards to convey insights effectively.
- Data Analysis: Utilize Power BI's powerful analytical tools to gain valuable insights from data.
- Data Modeling: Create robust data models to establish relationships between different datasets.
- DAX Formulas: Discover the magic of DAX (Data Analysis Expressions) to perform advanced calculations.
- Real-Time Dashboards: Implement real-time data connections to monitor changes dynamically.
- Performance Optimization: Optimize reports and dashboards for faster loading and smooth user experience.
Who is this for?
What You Need to Know?
More details
DescriptionWelcome to "Power BI: Your Journey to Data Visualization Excellence"! In this comprehensive and beginner-friendly course, you will embark on an exciting adventure into the world of data visualization using Microsoft Power BI. Whether you're a data enthusiast, business professional, analytics beginner, Excel user, IT specialist, entrepreneur, educator, or simply curious about data visualization, this course is your gateway to unlocking the true potential of your data.
Throughout this course, we'll start with the fundamentals, guiding you through Power BI's user-friendly interface, data importing, transformation, and relationship building. You'll learn to create captivating visualizations with charts, graphs, tables, and matrices while mastering formatting techniques for clarity.
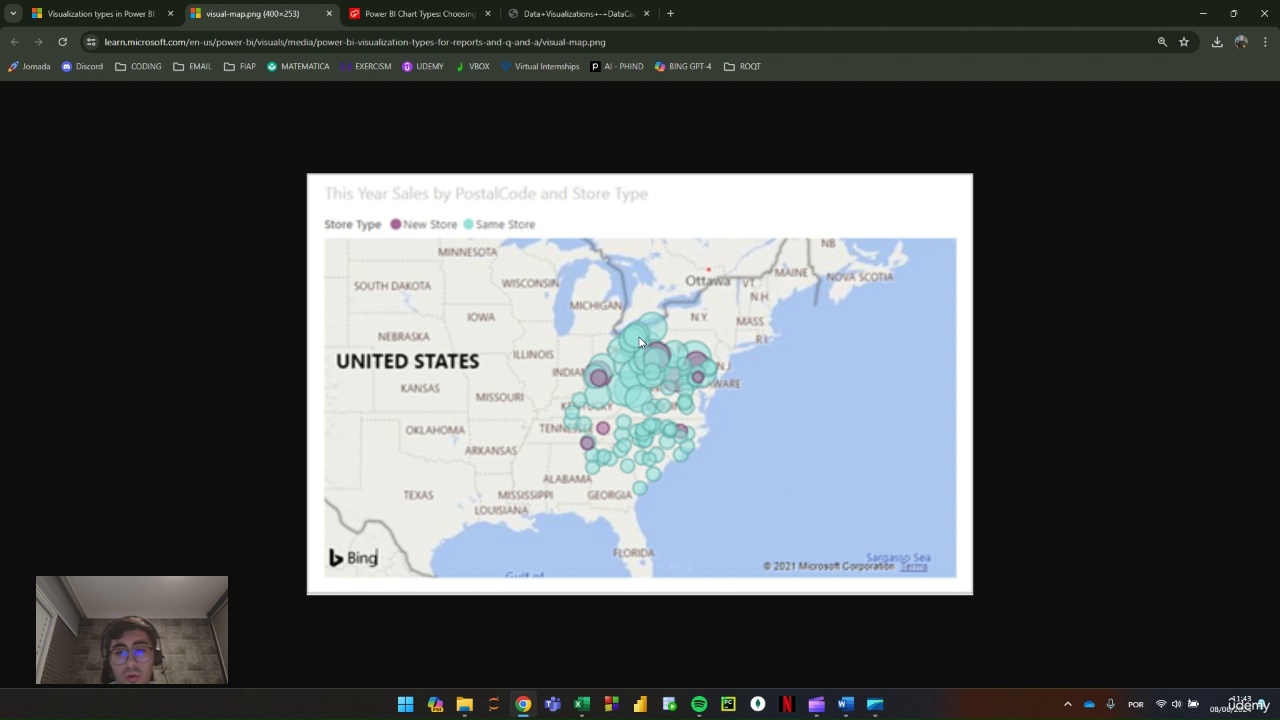
As we progress, we'll delve into advanced data visualization techniques, where you'll harness the power of maps, geospatial data, and interactive dashboards. You'll implement drill-through and hierarchical navigation to deliver insights at your audience's fingertips.
Data analysis becomes a breeze as you unlock the secrets of DAX (Data Analysis Expressions), enabling you to perform advanced calculations, measures, and time intelligence functions.
In the "Creating Interactive Reports" section, you'll master the art of interactivity with filters, slicers, bookmarks, and buttons, making your reports engaging and user-centric.
Our journey culminates in the "Putting It All Together - Final Project" section, where you'll showcase your prowess by executing a comprehensive Power BI project, incorporating storytelling, design principles, and advanced techniques for real-world data visualization scenarios.
As your guide, I'll be with you every step of the way, providing practical examples, hands-on exercises, and downloadable datasets. I'll ensure that you gain confidence in creating captivating data visualizations and insightful reports.
So, if you're ready to transform raw data into meaningful insights, join us in "Power BI: Your Journey to Data Visualization Excellence" and set off on an empowering and transformative data visualization adventure. Enroll now and unlock the true potential of your data!
Who this course is for:
- Power BI: Your Journey to Data Visualization Excellence" is an inclusive and beginner-friendly course designed for data enthusiasts, business professionals, analytics beginners, Excel users, IT professionals, entrepreneurs, educators, and anyone eager to unleash the power of data visualization with Microsoft Power BI. Whether you seek to make data-driven decisions, improve business operations, advance your career, or enhance your teaching toolkit, this course offers a comprehensive learning experience. From mastering Power BI's interface and data transformation to creating interactive visuals, advanced analytics, and compelling data stories, learners of all levels will gain valuable skills to confidently harness the potential of data visualization. Join us on this transformative journey and unlock the true power of your data!
Welcome to "Power BI: Your Journey to Data Visualization Excellence"! In this comprehensive and beginner-friendly course, you will embark on an exciting adventure into the world of data visualization using Microsoft Power BI. Whether you're a data enthusiast, business professional, analytics beginner, Excel user, IT specialist, entrepreneur, educator, or simply curious about data visualization, this course is your gateway to unlocking the true potential of your data.
Throughout this course, we'll start with the fundamentals, guiding you through Power BI's user-friendly interface, data importing, transformation, and relationship building. You'll learn to create captivating visualizations with charts, graphs, tables, and matrices while mastering formatting techniques for clarity.
As we progress, we'll delve into advanced data visualization techniques, where you'll harness the power of maps, geospatial data, and interactive dashboards. You'll implement drill-through and hierarchical navigation to deliver insights at your audience's fingertips.
Data analysis becomes a breeze as you unlock the secrets of DAX (Data Analysis Expressions), enabling you to perform advanced calculations, measures, and time intelligence functions.
In the "Creating Interactive Reports" section, you'll master the art of interactivity with filters, slicers, bookmarks, and buttons, making your reports engaging and user-centric.
Our journey culminates in the "Putting It All Together - Final Project" section, where you'll showcase your prowess by executing a comprehensive Power BI project, incorporating storytelling, design principles, and advanced techniques for real-world data visualization scenarios.
As your guide, I'll be with you every step of the way, providing practical examples, hands-on exercises, and downloadable datasets. I'll ensure that you gain confidence in creating captivating data visualizations and insightful reports.
So, if you're ready to transform raw data into meaningful insights, join us in "Power BI: Your Journey to Data Visualization Excellence" and set off on an empowering and transformative data visualization adventure. Enroll now and unlock the true potential of your data!
Who this course is for:
- Power BI: Your Journey to Data Visualization Excellence" is an inclusive and beginner-friendly course designed for data enthusiasts, business professionals, analytics beginners, Excel users, IT professionals, entrepreneurs, educators, and anyone eager to unleash the power of data visualization with Microsoft Power BI. Whether you seek to make data-driven decisions, improve business operations, advance your career, or enhance your teaching toolkit, this course offers a comprehensive learning experience. From mastering Power BI's interface and data transformation to creating interactive visuals, advanced analytics, and compelling data stories, learners of all levels will gain valuable skills to confidently harness the potential of data visualization. Join us on this transformative journey and unlock the true power of your data!
User Reviews
Rating

Rajat Eklare
Instructor's Courses
Udemy
View courses Udemy- language english
- Training sessions 24
- duration 12:06:36
- Release Date 2023/11/21