About Microsoft Power BILearn More
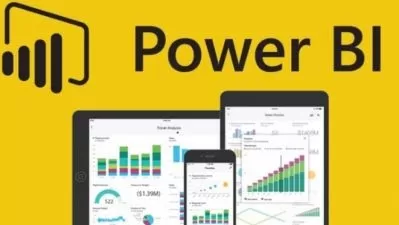
Microsoft Power BI for business intelligence is a collection of software services, apps, and connectors that bring unrelated data sources together for processing into clear, visual, and interactive reports. This intuitive service allows you to build customizable dashboards to help get the intel you need — no engineering skills required. Get Power BI training or certification and help your company make more informed business decisions.
Sort by:
Sorting
The newest
Most visited
Course time
Subtitle
Filtering
Courses
Subtitle

UdemyBI Essentials for Finance Analysts - Power BI Edition Specialization
5:53:47
English subtitles
01/09/2025
Books
Frequently asked questions about Microsoft Power BI
Microsoft Power BI is a software tool for business intelligence and analytics. The platform allows users to aggregate and share data with reports, visualizations, and other analytics tools. Microsoft Power BI is user-friendly, with intuitive tools for people across all levels of technical know-how. It integrates with Microsoft Excel and other products in the Microsoft suite. Organizations commonly use Microsoft Power BI to gather and analyze their business data in order to uncover insights that help them make data-driven business decisions. This may include reviewing metrics to assess progress on business goals, making predictions, and exploring potential scenarios to come up with business strategies. Within Microsoft Power BI, users can connect data sets from separate sources and perform advanced data analysis. Microsoft Power BI includes tools for building charts, graphs, and other data visualizations that you can easily share with multiple team members across an organization.
Microsoft Power BI is a popular choice for business intelligence tools because it is easy to learn, even for non-technical employees. Power BI is described as a self-service tool, meaning that users don’t need advanced skills in data analytics or engineering in order to use Power BI. Data science professionals, department managers, and administrators alike may leverage Microsoft Power BI to create data models, share reports, and measure departments’ or individual employees’ success against business goals. There are many free and paid resources to help you learn how to use Microsoft Power BI, from books and blog posts to online courses and webinars. A Microsoft Power BI course can teach you how to connect data sources such as Excel and organize the data in Power BI, form data models, create data visualizations and reports, and use data analysis expressions (DAX) to build formulas for data analytics.
Tableau and Power BI are both popular software tools for data analysis and business intelligence. Some users prefer Power BI because it is somewhat easier to learn than Tableau and comes at a more cost-effective price point. Those who already know how to use Microsoft Excel may find it faster to pick up Power BI, as the interface has a lot in common with Excel. Others prefer Tableau because it offers more robust data analytics features for advanced needs, more customization options, and is easier to scale as an organization grows. While Tableau comes at a steeper price and slightly steeper learning curve, it offers more control over tailored data models and analytics. For organizations requiring basic business analytics, Power BI is usually a good option. Tableau may be a better choice for those who want to do more custom analytics with their data.
Some of Power BI’s most common tools include Quick Insight, Power Query, built-in connectors, integration with Cortana, and features for artificial intelligence and machine learning. The Quick Insight tool allows you to break up your data into subsets and apply analytics to different subsets. The Power Query tool allows you to import, transform, and integrate data into the Power BI web service, where you can then share it across Power BI reports and dashboards. Power BI’s built-in connector tools make it simple to connect to various data sources, including Microsoft, Salesforce, and other software products. The Cortana integration for mobile devices allows you to query your data using voice technology through Microsoft’s digital assistant tool Cortana. Power BI also offers artificial intelligence (AI) tools for image recognition and text analysis, allowing users to create machine learning models. It even integrates with Azure Machine Learning to give users more AI capabilities.
Data modeling is the process of connecting multiple sources of data in the Power BI tool. To do this, you define a relationship between sources of data, which describes how those separate sources are connected. Then, within Power BI, you can analyze, organize, compare, and manipulate the data from those sources in one place. Within Power BI’s modeling view, users can organize how they’d like to view data, splitting data models and subsets into different diagrams, display folders, and more. This makes it easy to organize data by subject matter or business category. By using data modeling to create relationships, you can conduct advanced calculations between different data sets and build visualizations, charts, and reports that pull in data from multiple sources. This is extremely valuable for gaining cohesive business insights using data gathered from different channels.
Microsoft offers both free and paid versions of the Power BI software for different needs. The free tier of Microsoft Power BI comes as a desktop application and has many great features made with small and medium-sized businesses in mind. The paid version comes as a cloud-based software-as-a-service (Saas), in which organizations pay a monthly subscription fee for a number of user licenses. Businesses using both the free and paid professional versions of Power BI have the ability to download it as a mobile application (available on Windows, Android, and iOS smartphones and tablets). For organizations that need to store and manage their data on-premises, Microsoft also offers Power BI Report Server, which comes as a separate desktop application so companies can keep their data on their own servers.


