Power BI Mastery for Sales Managers from Beginner to Pro
Sohel Jagirdar
5:21:26
Description
Power BI Course For Sales Managers for creating Sales, Revenue, KPI's Reports and Dashboards without coding
What You'll Learn?
- Master data visualization: Learn how to create visually stunning charts, graphs, and other visualizations to effectively communicate insights from your data.
- Build interactive dashboards: Gain the skills to design interactive dashboards that allow users to explore data and uncover trends and patterns on their own.
- Understand data modeling: Explore techniques for structuring and organizing data within Power BI to create reliable and efficient data models.
- Share insights effectively: Learn how to share your Power BI reports and dashboards with stakeholders, collaborate with team members
Who is this for?
What You Need to Know?
More details
DescriptionLearn to Create sales, revenue, expenses reports, and realistic forecasts for your management team using Power BI
Gather Data: Collect data from various sources including sales records, financial statements, and expense reports. Ensure that the data is clean and properly formatted.
Import Data into Power BI: Open Power BI Desktop and import the data into the software. Power BI supports a wide range of data sources including Excel, CSV, databases, and online services.
Transform Data: Use Power Query Editor to clean and transform the data as needed. This may involve removing duplicates, handling missing values, and creating calculated columns or measures.
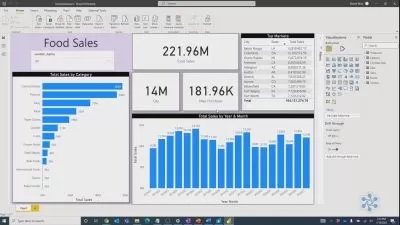
Create Reports: Design reports to showcase sales, revenue, expenses, and forecasts. Use visuals such as line charts, bar charts, and tables to present the data effectively. Arrange the visuals on a canvas to create a dashboard layout.
Add Interactivity: Enhance the reports by adding interactivity features such as slicers, filters, and drill-through options. This allows users to dynamically explore the data and gain deeper insights.
Calculate Key Metrics: Calculate important KPIs (Key Performance Indicators) such as profit margins, customer acquisition cost, and sales growth rate. Display these metrics prominently on the dashboard.
Create Forecasts: Utilize Power BI's forecasting capabilities to generate realistic forecasts based on historical data. Adjust the forecasting parameters as needed to improve accuracy.
Review and Iterate: Review the reports with the management team to ensure they meet their requirements. Make any necessary adjustments based on feedback.
Publish and Share: Once the reports are finalized, publish them to the Power BI service. Share the reports with the management team and other stakeholders, granting appropriate access permissions.
Monitor Performance: Continuously monitor the performance of the reports and update them as new data becomes available. Use Power BI's usage analytics to track user engagement and identify areas for improvement.
Who this course is for:
- IT or anyone who want to learn Power BI
- Sales, Executives, and Professionals across industries seeking data-driven insights. Aspiring Data Analysts with no coding background. Entrepreneurs aiming to optimize operations with data. Students in business, economics, or stats enhancing analytical skills. Curious learners interested in visualizing and analyzing data without coding.
Learn to Create sales, revenue, expenses reports, and realistic forecasts for your management team using Power BI
Gather Data: Collect data from various sources including sales records, financial statements, and expense reports. Ensure that the data is clean and properly formatted.
Import Data into Power BI: Open Power BI Desktop and import the data into the software. Power BI supports a wide range of data sources including Excel, CSV, databases, and online services.
Transform Data: Use Power Query Editor to clean and transform the data as needed. This may involve removing duplicates, handling missing values, and creating calculated columns or measures.
Create Reports: Design reports to showcase sales, revenue, expenses, and forecasts. Use visuals such as line charts, bar charts, and tables to present the data effectively. Arrange the visuals on a canvas to create a dashboard layout.
Add Interactivity: Enhance the reports by adding interactivity features such as slicers, filters, and drill-through options. This allows users to dynamically explore the data and gain deeper insights.
Calculate Key Metrics: Calculate important KPIs (Key Performance Indicators) such as profit margins, customer acquisition cost, and sales growth rate. Display these metrics prominently on the dashboard.
Create Forecasts: Utilize Power BI's forecasting capabilities to generate realistic forecasts based on historical data. Adjust the forecasting parameters as needed to improve accuracy.
Review and Iterate: Review the reports with the management team to ensure they meet their requirements. Make any necessary adjustments based on feedback.
Publish and Share: Once the reports are finalized, publish them to the Power BI service. Share the reports with the management team and other stakeholders, granting appropriate access permissions.
Monitor Performance: Continuously monitor the performance of the reports and update them as new data becomes available. Use Power BI's usage analytics to track user engagement and identify areas for improvement.
Who this course is for:
- IT or anyone who want to learn Power BI
- Sales, Executives, and Professionals across industries seeking data-driven insights. Aspiring Data Analysts with no coding background. Entrepreneurs aiming to optimize operations with data. Students in business, economics, or stats enhancing analytical skills. Curious learners interested in visualizing and analyzing data without coding.
User Reviews
Rating

Sohel Jagirdar
Instructor's Courses
Udemy
View courses Udemy- language english
- Training sessions 60
- duration 5:21:26
- Release Date 2024/06/25