Power BI: Financial Data Analysis using Power BI 2023
AI Sciences,AI Sciences Team
2:18:24
Description
Develop a Complete Financial Analysis Dashboard With the Help of Power BI and being Expert in Power BI
What You'll Learn?
- • The importance of Power BI Financial Analysis.
- • Power BI and why Power BI is important.
- • How to work on Power BI.
- • Analyzing Sales Calculation and Matrix Formatting.
- • How to prepare P&L, calculate profits, KPI for visualization, and Data Slicers.
- • The whole procedure of Power BI Financial Analytics, from installing to comparing data with steps.
- • How to compare Power BI with MS Excel.
- • The resources of Power BI Financial Analyst.
- • The visualization features such as visualizing sales trends and adding slicers.
- • Analyze P&L as charts for P&L, Comparison for P&L, and Analyze.
- • And much more…
Who is this for?
More details
DescriptionComprehensive Course Description:
Do you want to set up a simple, reliable, and efficient Power BI system for your business?
Do you want to master sales calculation, analyze sales, and visualize trends?
And do you want to become an expert in Profit &Loss Statement Preparation, Visualizations, Charts, and Financial Data Analysis?
Then this short detailed course is for you!
Power BI, first launched in July 2011, is a Microsoft business intelligence tool. It combines multiple data sources into a single view.
Power BI isn’t just for financial data analysis. You can use Power BI to manage all the activities of a company, including manufacturing processes, market analysis, logistics, customer relations, human resources, sales, and so on. That’s not all. The data of each department can be viewed in an interactive, understandable, and visual format.
The top feature of Power BI is it can convert unconnected and raw data into visually meaningful, actionable, and interactive information. This tool renders decision-making easier by processing the data such that it is easily understandable, highly reliable, and extremely meaningful.
This course is a full package for beginners to learn the various elements of Power BI, right from installation to visualization. The descriptive content in each module covers the essential theoretical concepts with a comprehensive practical approach.
You will start with the installation of Power BI only after an in-depth overview of the tool. In the third module, you will learn about analyzing monthly and quarterly data. In the final module, you will learn about the different financial analysis terms, such as gross profit, EBITDA, and net profit.
The key advantage of this course is you start from the basics and progress to advanced concepts of Power BI. You will learn to evaluate data by using the different operations on the datasets.
This course is designed for beginners who know nothing about Data Analysis, Power BI, and Data Representation.
Why Should You Enroll in This Course?
In this learning by doing course, you will learn about Power BI Desktop in great detail. The focus is on how this tool is used in data analysis and financial analysis. You will master financial data analysis concepts such as sales calculation, monthly, quarterly, and yearly sales analysis, and visualization with charts.
The course is crafted to help you understand how to visualize sales trends using Power BI. You will also learn about preparing and analyzing Profit and Loss Statements. The unique hands-on approach of this course will help you set up a custom Power BI system for any business.
This course is:
· Easy to understand.
· In-depth and self-explanatory.
· Concise and to the point.
· More about practical implementation and less about theoretical concepts.
Teaching Is Our Passion:
Our online learning materials encourage learning by doing. You will get more than a superficial look at a practical approach toward Power BI using financial data and data evaluation. The course instructor is knowledgeable in Power BI and has worked hard to ensure the subtopics transition smoothly so that you understand the concepts clearly.
You will move onward to complex Power BI concepts only after you gain a sound understanding of the fundamentals. Easy access to the course materials at the beginning of each module make certain you accomplish all your learning goals. In addition to the high-quality video content, you can also access course notes and handouts. And in case of any course-related queries, you can contact our friendly team.
Course Content:
You will learn how to install Power BI Desktop and how to use the Analysis feature in Power BI. The following is the list of some of the topics that you will be learning:
1. Course Overview
2. Overview of Power BI
§ Brief overview of Power BI
§ Need for Power BI
§ Comparison of Power BI and Excel
§ Rule Based vs. Self Learning Power BI
§ Working mechanism of Power BI
§ Installation and the working of Power BI and different settings
3. Sales Calculation, Analyzing Sales, and Visualizing trends
§ Understanding data and usage of GL
§ Developing data, calculating sales, and matrix formatting
§ Analysis data quarterly and monthly
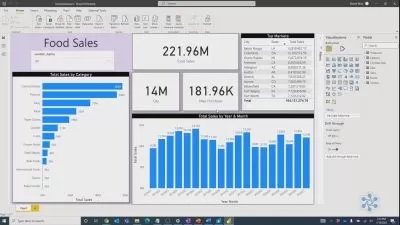
§ Visualizing Data, Charts, and Data Slicer
4. P&L Preparation, Visualizations, and Charts and Data Analysis
§ Gross Profit, EBITDA, and Net profit by Power BI
§ Visualize the data by using the cards, numbers, and data slicer
§ Add data by adding charts
§ Analysis of data by charts analysis and by analyzing the results
Enroll in this course and become a Power BI expert today!
After completing this course successfully, you will be able to:
· Relate the concepts and theories for Power BI in relation to financial data analysis
· Understand, implement operations, and evaluate data by using Power BI
· Visualize with charts monthly, quarterly, and yearly analysis.
Who this course is for:
· Power BI beginners
· Data analysts
· Business analysts
· Financial analysts
· Data science enthusiasts
· Research Scholars
· Data Scientists.
Who this course is for:
- • Power BI beginners
- • Data analysts
- • Business analysts
- • Financial analysts
- • Data science enthusiasts
- • Research Scholars
- • Data Scientists.
Comprehensive Course Description:
Do you want to set up a simple, reliable, and efficient Power BI system for your business?
Do you want to master sales calculation, analyze sales, and visualize trends?
And do you want to become an expert in Profit &Loss Statement Preparation, Visualizations, Charts, and Financial Data Analysis?
Then this short detailed course is for you!
Power BI, first launched in July 2011, is a Microsoft business intelligence tool. It combines multiple data sources into a single view.
Power BI isn’t just for financial data analysis. You can use Power BI to manage all the activities of a company, including manufacturing processes, market analysis, logistics, customer relations, human resources, sales, and so on. That’s not all. The data of each department can be viewed in an interactive, understandable, and visual format.
The top feature of Power BI is it can convert unconnected and raw data into visually meaningful, actionable, and interactive information. This tool renders decision-making easier by processing the data such that it is easily understandable, highly reliable, and extremely meaningful.
This course is a full package for beginners to learn the various elements of Power BI, right from installation to visualization. The descriptive content in each module covers the essential theoretical concepts with a comprehensive practical approach.
You will start with the installation of Power BI only after an in-depth overview of the tool. In the third module, you will learn about analyzing monthly and quarterly data. In the final module, you will learn about the different financial analysis terms, such as gross profit, EBITDA, and net profit.
The key advantage of this course is you start from the basics and progress to advanced concepts of Power BI. You will learn to evaluate data by using the different operations on the datasets.
This course is designed for beginners who know nothing about Data Analysis, Power BI, and Data Representation.
Why Should You Enroll in This Course?
In this learning by doing course, you will learn about Power BI Desktop in great detail. The focus is on how this tool is used in data analysis and financial analysis. You will master financial data analysis concepts such as sales calculation, monthly, quarterly, and yearly sales analysis, and visualization with charts.
The course is crafted to help you understand how to visualize sales trends using Power BI. You will also learn about preparing and analyzing Profit and Loss Statements. The unique hands-on approach of this course will help you set up a custom Power BI system for any business.
This course is:
· Easy to understand.
· In-depth and self-explanatory.
· Concise and to the point.
· More about practical implementation and less about theoretical concepts.
Teaching Is Our Passion:
Our online learning materials encourage learning by doing. You will get more than a superficial look at a practical approach toward Power BI using financial data and data evaluation. The course instructor is knowledgeable in Power BI and has worked hard to ensure the subtopics transition smoothly so that you understand the concepts clearly.
You will move onward to complex Power BI concepts only after you gain a sound understanding of the fundamentals. Easy access to the course materials at the beginning of each module make certain you accomplish all your learning goals. In addition to the high-quality video content, you can also access course notes and handouts. And in case of any course-related queries, you can contact our friendly team.
Course Content:
You will learn how to install Power BI Desktop and how to use the Analysis feature in Power BI. The following is the list of some of the topics that you will be learning:
1. Course Overview
2. Overview of Power BI
§ Brief overview of Power BI
§ Need for Power BI
§ Comparison of Power BI and Excel
§ Rule Based vs. Self Learning Power BI
§ Working mechanism of Power BI
§ Installation and the working of Power BI and different settings
3. Sales Calculation, Analyzing Sales, and Visualizing trends
§ Understanding data and usage of GL
§ Developing data, calculating sales, and matrix formatting
§ Analysis data quarterly and monthly
§ Visualizing Data, Charts, and Data Slicer
4. P&L Preparation, Visualizations, and Charts and Data Analysis
§ Gross Profit, EBITDA, and Net profit by Power BI
§ Visualize the data by using the cards, numbers, and data slicer
§ Add data by adding charts
§ Analysis of data by charts analysis and by analyzing the results
Enroll in this course and become a Power BI expert today!
After completing this course successfully, you will be able to:
· Relate the concepts and theories for Power BI in relation to financial data analysis
· Understand, implement operations, and evaluate data by using Power BI
· Visualize with charts monthly, quarterly, and yearly analysis.
Who this course is for:
· Power BI beginners
· Data analysts
· Business analysts
· Financial analysts
· Data science enthusiasts
· Research Scholars
· Data Scientists.
Who this course is for:
- • Power BI beginners
- • Data analysts
- • Business analysts
- • Financial analysts
- • Data science enthusiasts
- • Research Scholars
- • Data Scientists.
User Reviews
Rating
AI Sciences
Instructor's CoursesAI Sciences Team
Instructor's Courses
Udemy
View courses Udemy- language english
- Training sessions 31
- duration 2:18:24
- Release Date 2023/02/13


