Companies Home Search Profile

Power BI Data Dashboards

Focused View

Helen Wall

2:24:04

66 View
  • 01 - Building data dashboards in Power BI.mp4
    00:38
  • 02 - What you should know.mp4
    00:36
  • 03 - Setting up the Power BI model.mp4
    01:40
  • 04 - Building the Power BI ecosystem.mp4
    02:04
  • 05 - Choosing colors.mp4
    04:04
  • 01 - Configuring table and matrix visuals.mp4
    05:02
  • 02 - Building hierarchies.mp4
    03:11
  • 03 - Creating lists and bins.mp4
    05:18
  • 04 - Applying filters.mp4
    04:37
  • 05 - Building and using DAX formulas.mp4
    06:00
  • 06 - Using quick measures formulas.mp4
    06:19
  • 07 - Formatting visuals.mp4
    03:30
  • 08 - Adding color gradients to heatmaps.mp4
    04:57
  • 09 - Utilizing report themes.mp4
    02:05
  • 01 - Visualizing time-intelligence trends.mp4
    03:54
  • 02 - Using column charts to visualize trends.mp4
    05:16
  • 03 - Ranking categorical totals.mp4
    05:41
  • 04 - Comparing proportions.mp4
    02:39
  • 05 - Setting up histograms.mp4
    03:01
  • 06 - Utilizing scatter plots.mp4
    04:39
  • 07 - Challenge Visualizing data.mp4
    00:46
  • 08 - Solution Visualizing data.mp4
    02:09
  • 01 - Analytics options Reference, trend, and forecast lines.mp4
    02:56
  • 02 - Creating sparklines to quickly view trends.mp4
    02:06
  • 03 - Leveraging box plots and violin plots.mp4
    02:14
  • 04 - Visualizing flows with Sankey charts.mp4
    03:31
  • 05 - Examining key performance indicators (KPIs).mp4
    02:03
  • 06 - Challenge Analyzing multiple variables.mp4
    00:42
  • 07 - Solution Analyzing multiple variables.mp4
    02:37
  • 01 - Shape map visual.mp4
    02:55
  • 02 - Shape map visual.mp4
    05:23
  • 03 - Drilling through map levels.mp4
    03:13
  • 04 - Mapping flow patterns.mp4
    03:27
  • 05 - Challenge Map visuals.mp4
    00:19
  • 06 - Solution Map visuals.mp4
    02:21
  • 01 - Customing tooltips.mp4
    04:19
  • 02 - Configuring chiclet slicers.mp4
    03:59
  • 03 - Displaying Top N rankings.mp4
    03:15
  • 04 - Syncing slicers between pages.mp4
    04:11
  • 05 - Creating dashboards.mp4
    02:03
  • 06 - Adding nudge prompts to promote interactions.mp4
    04:02
  • 01 - Creating a phone view.mp4
    02:52
  • 02 - Publishing to Power BI service.mp4
    03:17
  • 03 - Sharing Power BI models.mp4
    03:30
  • 01 - Getting more out of Power BI.mp4
    00:43
  • Description


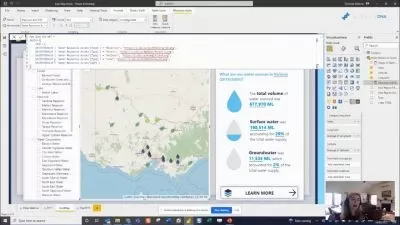
    Power BI is a powerful data analytics application for modeling data and creating data visualizations. To truly leverage the power of Power BI, you need to use your visuals impactfully to communicate trends and analysis to make decisions. In this course, data analytics and business analysis expert Helen Wall focuses on the Power BI dashboard, where users interact with charts and graphs that communicate trends in their data. Go over building data dashboards, setting up the Power BI model and ecosystem, and choosing colors. Explore various tools to work with and data and visualize it. Learn ways to compare multiple values, and dive into the mapping options available to you. Find out how to customize tooltips, configure chiclet slicers, display Top N rankings, and more, to put it all together in your own dashboard. To wrap up, learn how to share your work with a phone view, publishing to the Power BI service, and sharing Power BI models.

    More details


    User Reviews
    Rating
    0
    0
    0
    0
    0
    average 0
    Total votes0
    Focused display
    Follow me to see my latest published content on data science, analytics, and visualization! Aficionado of Power BI, AWS, Tableau, and Excel (including Power Query), and currently diving deep into the world of Python, R, and AI (including machine learning). Designer and developer of business intelligence dashboards and visualizations supporting many business functions and industries.
    LinkedIn Learning is an American online learning provider. It provides video courses taught by industry experts in software, creative, and business skills. It is a subsidiary of LinkedIn. All the courses on LinkedIn fall into four categories: Business, Creative, Technology and Certifications. It was founded in 1995 by Lynda Weinman as Lynda.com before being acquired by LinkedIn in 2015. Microsoft acquired LinkedIn in December 2016.
    • language english
    • Training sessions 45
    • duration 2:24:04
    • English subtitles has
    • Release Date 2023/10/03

    Courses related to Data Science

    Courses related to Microsoft Power BI

    Subtitle
    Microsoft Power Automate Master Basics in Just 40 Mins!
    Subtitle
    Designing Dashboards in Power BI