Power BI-Beginner
GreyCampus Edutech
6:52:11
Description
Power BI-Beginner
What You'll Learn?
- Introduction to Power BI: Gain a foundational understanding of Power BI and its components.
- Importing Data from Various Sources: Discover how to import data from databases, cloud services, and local files.
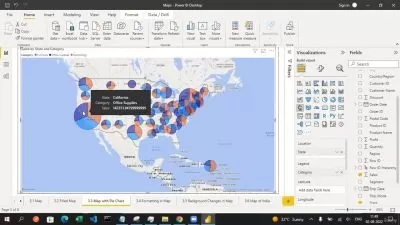
- Visualizations: Create a variety of charts and visualizations including Clustered or Stacked Chart, Treemaps, Area Chart, Donut Chart, Cards, Multicard, Gauge C
- Import Direct Query and Live Connection: Understand how to use Direct Query and Live Connection for real-time data analysis and Data Transformations
- Advanced Functions: Dive into advanced DAX functions such as DEFINE and MEASURE, EVALUATE, VARIABLE, SWITCH, KEEPFILTERS, ALLSELECTED, RANKX, SELECTEDVALUE, and
- Data Fields and Conditional Formatting: Explore the use of data fields and configure conditional formatting to enhance your reports.
Who is this for?
What You Need to Know?
More details
DescriptionWelcome to our Power BI Primer course, your gateway to the dynamic world of data visualization. This course is designed to introduce you to the basics of using Power BI to transform raw data into meaningful visualizations, enabling data-driven decisions for everyone.
GreyCampus' Power BI Primer course delves into the essential concepts of data visualization and analysis using Microsoft Power BI. You will learn to create interactive dashboards and reports, transforming raw data into valuable insights. Topics include importing data from various sources, data transformation, and creating visualizations like charts and maps, this course equips you to communicate your findings effectively. Ideal for beginners, it makes embracing data-driven decision-making simple and accessible.
This course is perfect for aspiring data analysts, students, professionals, researchers, freelancers, and anyone interested in data visualization. By the end of the course, you will be well equipped to handle complex data visualization challenges, enhance your analytical skills, and contribute significantly to data-driven decision-making within your organization.
Begin your journey to mastering data visualization with Power BI. Throughout this course, you will develop the confidence and expertise to apply advanced techniques and tackle real-world data challenges effectively. Unlock the full potential of your data with Power BI.
Who this course is for:
- Aspiring Data Analysts
- Students and Academics
- Professionals in Various Industries
- Freelancers
- IT and Database Professionals
- Anyone Interested in Data Visualization
Welcome to our Power BI Primer course, your gateway to the dynamic world of data visualization. This course is designed to introduce you to the basics of using Power BI to transform raw data into meaningful visualizations, enabling data-driven decisions for everyone.
GreyCampus' Power BI Primer course delves into the essential concepts of data visualization and analysis using Microsoft Power BI. You will learn to create interactive dashboards and reports, transforming raw data into valuable insights. Topics include importing data from various sources, data transformation, and creating visualizations like charts and maps, this course equips you to communicate your findings effectively. Ideal for beginners, it makes embracing data-driven decision-making simple and accessible.
This course is perfect for aspiring data analysts, students, professionals, researchers, freelancers, and anyone interested in data visualization. By the end of the course, you will be well equipped to handle complex data visualization challenges, enhance your analytical skills, and contribute significantly to data-driven decision-making within your organization.
Begin your journey to mastering data visualization with Power BI. Throughout this course, you will develop the confidence and expertise to apply advanced techniques and tackle real-world data challenges effectively. Unlock the full potential of your data with Power BI.
Who this course is for:
- Aspiring Data Analysts
- Students and Academics
- Professionals in Various Industries
- Freelancers
- IT and Database Professionals
- Anyone Interested in Data Visualization
User Reviews
Rating

GreyCampus Edutech
Instructor's Courses
Udemy
View courses Udemy- language english
- Training sessions 28
- duration 6:52:11
- Release Date 2024/11/19