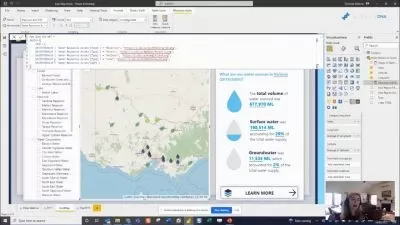
Power BI Advanced: Take your Power BI Skills to a New Level
Grant Gamble
7:10:34
Description
Hone your Power BI Expertise by Learning Advanced Power BI Skills and Techniques
What You'll Learn?
- Advanced features of Microsoft Power BI
- Extend your knowledge of Power Query
- Advanced insights into Power Query and the M language
- Advanced data modelling and visualization techniques
Who is this for?
More details
DescriptionThe G Com Solutions Power BI Advanced course is designed to give experienced Power BI users the opportunity to hone their expertise in Power BI by tackling a series of challenging and useful Power BI techniques.
This course assumes that you are already familiar with Power Query and so we dive straight into advanced topics like the optimizing Data Types, column Profiling and writing M language code, as well as discussing advanced data connection techniques used when working with JSON, XML and SharePoint libraries and folders.
The course also provides further practice on data modelling, discussing such topics as role-playing dimensions and use of inactive relationships to cater for multiple significant dates within a main fact table. And, naturally, you will get plenty of additional practice in all aspects of DAX: calculated columns, calculated tables, DAX measures and time-intelligence functions.
As an advanced Power BI report developer, it is also important that you build and utilize datasets in the most efficient manner. In this course, you will learn how to implement data centralization by using PBIDS Files, disabling the export of static data from your reports, creating dataflows and shared Datasets and how to promote and certifying your centralized datasets.
The course also provides advanced visualization practice, and you will be given the opportunity to create a sophisticated sales pipeline dashboard, starting from scratch and using such techniques as dynamic chart titles and colors and Dynamically Showing a Chart.
Then, back in the Power BI service, we discuss the finer points of dashboard tiles: Creating Hyperlinks in a Text Box, working with Image Tiles, Web content tiles, Video Tiles, and Streaming Real-time data by integrating Power Automate functionality.
We then turn our attention to visualizing our data, we look at using the form of visual as well as displaying a hierarchy of images in slices, which enable the user to track the performance of sales managers, as well as individual salespeople. We also look at a useful technique for creating a chart which only becomes visible when a slicer selection is made by the user.
In short, this course will offer Power BI users who are familiar with all of the fundamentals a challenging hands-on workshop, which will expand their familiarity with Power BI best practices, data modelling, visualization and report creation.
Who this course is for:
- Existing users of Power BI looking to extend their knowledge
The G Com Solutions Power BI Advanced course is designed to give experienced Power BI users the opportunity to hone their expertise in Power BI by tackling a series of challenging and useful Power BI techniques.
This course assumes that you are already familiar with Power Query and so we dive straight into advanced topics like the optimizing Data Types, column Profiling and writing M language code, as well as discussing advanced data connection techniques used when working with JSON, XML and SharePoint libraries and folders.
The course also provides further practice on data modelling, discussing such topics as role-playing dimensions and use of inactive relationships to cater for multiple significant dates within a main fact table. And, naturally, you will get plenty of additional practice in all aspects of DAX: calculated columns, calculated tables, DAX measures and time-intelligence functions.
As an advanced Power BI report developer, it is also important that you build and utilize datasets in the most efficient manner. In this course, you will learn how to implement data centralization by using PBIDS Files, disabling the export of static data from your reports, creating dataflows and shared Datasets and how to promote and certifying your centralized datasets.
The course also provides advanced visualization practice, and you will be given the opportunity to create a sophisticated sales pipeline dashboard, starting from scratch and using such techniques as dynamic chart titles and colors and Dynamically Showing a Chart.
Then, back in the Power BI service, we discuss the finer points of dashboard tiles: Creating Hyperlinks in a Text Box, working with Image Tiles, Web content tiles, Video Tiles, and Streaming Real-time data by integrating Power Automate functionality.
We then turn our attention to visualizing our data, we look at using the form of visual as well as displaying a hierarchy of images in slices, which enable the user to track the performance of sales managers, as well as individual salespeople. We also look at a useful technique for creating a chart which only becomes visible when a slicer selection is made by the user.
In short, this course will offer Power BI users who are familiar with all of the fundamentals a challenging hands-on workshop, which will expand their familiarity with Power BI best practices, data modelling, visualization and report creation.
Who this course is for:
- Existing users of Power BI looking to extend their knowledge
User Reviews
Rating
Grant Gamble
Instructor's Courses
Udemy
View courses Udemy- language english
- Training sessions 73
- duration 7:10:34
- Release Date 2023/03/02


