Companies Home Search Profile

Microsoft Power BI Portfolio in a Day

Focused View

Sean Chandler

20:12:37

14 View
  • 1.1 austinHousingData.xlsx
  • 1.2 DAX 101 - Sweatpants BI.html
  • 1.3 Download Microsoft Power BI Desktop.html
  • 1.4 Kraken Koffee Sales - Excel Version.xlsx
  • 1.5 marketmindz research data dictionary.csv
  • 1.6 marketmindz research data.csv
  • 1.7 people data.csv
  • 1.8 people employment history.csv
  • 1. Course Introduction.mp4
    33:57
  • 1.1 marketmindz research data dictionary.csv
  • 1.2 marketmindz research data.csv
  • 1. Introduction and Kick-Off.mp4
    01:15
  • 2. Part 1 Understanding the Problem Statement (Dataset Attached).mp4
    02:04
  • 3. Part 2 Reviewing the Data.mp4
    05:32
  • 4. Part 3 Transforming the Data.mp4
    17:21
  • 5. Part 4 Evaluating Campaign Performance.mp4
    14:46
  • 6. Part 4 Evaluating Campaign Performance (Continued).mp4
    12:25
  • 7. Part 5 Evaluating Buyer Composition.mp4
    15:27
  • 8. Part 6 Uncovering Purchase Drivers.mp4
    09:53
  • 9. Part 7 Designing Your Layout - Choosing a Color Palette.mp4
    03:44
  • 10. Part 7 Designing Your Layout - Page Background.mp4
    11:46
  • 11. Part 7 Designing Your Layout - Designing a MarketMindz Logo.mp4
    06:02
  • 12. Part 7 Designing Your Layout - Applying Your Designs.mp4
    08:59
  • 13. Part 8 Designing a Beautiful Report - Campaign Performance.mp4
    18:37
  • 14. Part 8 Designing a Beautiful Report - Campaign Performance Continued.mp4
    10:27
  • 15. Part 8 Designing a Beautiful Report - Buyer Composition.mp4
    15:43
  • 16. Part 8 Designing a Beautiful Report - Buyer Composition Continued.mp4
    12:11
  • 17. Part 8 Designing a Beautiful Report - Purchase Drivers.mp4
    04:42
  • 18. Part 8 Designing a Beautiful Report - Purchase Drivers Continued.mp4
    13:02
  • 19.1 marketmindz demo complete.zip
  • 19. Part 9 Finishing Touches & Storytelling Elements.mp4
    10:17
  • 1.1 Kraken Koffee Sales - Excel Version.xlsx
  • 1. Introduction and Kick-Off.mp4
    02:25
  • 2. Part 1 Examining the Kraken Koffee Sales Dataset.mp4
    16:50
  • 3. Part 2 Modeling the Kraken Koffee Sales Dataset.mp4
    05:24
  • 4. Part 3 Determining the Kraken Koffee Story.mp4
    09:29
  • 5. Part 4 Some Basic DAX.mp4
    13:33
  • 6. Part 4 Some Less Basic DAX.mp4
    11:19
  • 7. Part 4 No DAX Whatsoever, I Promise..mp4
    03:56
  • 8. Part 5 Kraken Koffee Summary Visuals.mp4
    25:17
  • 9. Part 6 Kraken Koffee Time-Series Visuals.mp4
    27:13
  • 10. Part 7 Kraken Koffee Forecast Calculation.mp4
    10:19
  • 11. Part 7 Kraken Koffee Forecast Continued.mp4
    11:36
  • 12. Part 7 Kraken Koffee Forecast Data Label.mp4
    04:44
  • 13. Part 7 Kraken Koffee Forecast Data Visuals.mp4
    07:48
  • 14.1 Collateral.pptx
  • 14. Part 8 Working with a Pre-Determined Color Palette.mp4
    10:09
  • 15. Part 8 Designing an Infographic Canvas.mp4
    10:18
  • 16. Part 8 Designing a Cool KPI Card Section Outside of Power BI.mp4
    13:38
  • 17. Part 8 Cutting Out Text Boxes.mp4
    03:16
  • 18. Part 8 Adding Some Nautical Elements to Our Design.mp4
    12:13
  • 19. Part 8 Importing Our Design to Power BI.mp4
    03:23
  • 20. Part 9 Integrating Data Visuals into the Infographic Design - Summary Section.mp4
    15:04
  • 21. Part 9 Integrating Data Visuals into the Infographic Design - Time Section.mp4
    07:24
  • 22. Part 9 Integrating Data Visuals into the Infographic Design - Forecast Section.mp4
    10:21
  • 23. Part 10 Smart Narrative for Summary Section.mp4
    11:48
  • 24. Part 10 Smart Narrative for Time-Series Section.mp4
    12:42
  • 25.1 Background.pptx
  • 25.2 kraken koffee final.zip
  • 25. Part 10 Smart Narrative for Forecast Section.mp4
    14:59
  • 1.1 austinHousingData.xlsx
  • 1.2 flag of austin, texas.zip
  • 1. Introduction and Kick-Off.mp4
    02:55
  • 2. Part 1 - Data Exploration.mp4
    12:04
  • 3. Part 2 - Data Cleaning.mp4
    09:26
  • 4. Part 2 - Fact and Dimension Tables.mp4
    09:08
  • 5. Part 2 - School Dimension.mp4
    05:02
  • 6. Part 2 - Remaining Dimension Tables.mp4
    10:01
  • 7. Part 2 - Modeling Text Data and Reducing Data Models.mp4
    18:23
  • 8. Intermission - Changing Visual Interactions from Cross-Highlighting to Filtering.mp4
    03:19
  • 9. Part 3 - Summary KPIs Using the New and Improved Card Visual.mp4
    18:11
  • 10. Part 3 - Summary Insights.mp4
    19:21
  • 11. Part 4 - Working with Geolocational Data.mp4
    23:25
  • 12. Part 4 - Working with School Insights and Dynamic Legend Groups.mp4
    23:45
  • 13. Part 4- Using Field Parameters to Explore Drivers of Home Prices.mp4
    16:49
  • 14. Part 4 - Which Words Are Used to Describe Homes at Different Price Points.mp4
    28:33
  • 15. Part 4 - Using the Key Influencers Visual to Identify Drivers of Listing Price.mp4
    07:34
  • 16. Part 5 - Choosing a Color Palette (Again).mp4
    11:58
  • 17. Part 5 - Designing a Layout for Austin Real Estate Insights Data.mp4
    19:37
  • 18. Part 5 - Migrating Your Design and Color Palette to Power BI.mp4
    04:46
  • 19. Part 6 - Integrating Our Design with Our Summary Insights View.mp4
    27:00
  • 20. Part 6 - Integrating Our Design with Our Location View.mp4
    14:01
  • 21. Part 6 - Integrating Our Design with Our School View.mp4
    30:54
  • 22. Part 6 - Integrating Our Design with Our Features View.mp4
    15:06
  • 23. Part 7 - Building Buttons for Bookmark Navigation.mp4
    15:03
  • 24. Part 7 - Setting Up a Custom Slicer Panel.mp4
    26:05
  • 25. Part 8 - Setting Up a Tooltip Report Page.mp4
    17:12
  • 26.1 housing data background.pptx
  • 26.2 housing data completed.zip
  • 26. Part 9 - Designing a Simple, Effective Cover Page.mp4
    20:09
  • 1.1 Dates.xlsx
  • 1.2 people data.csv
  • 1.3 people employment history.csv
  • 1. Introduction and Kick-Off.mp4
    01:49
  • 2. Part 1 - Data Exploration & Modeling.mp4
    45:12
  • 3. Part 2 - Measure Tables.mp4
    04:39
  • 4. Part 3 - Headcount Calculation.mp4
    12:31
  • 5. Part 3 - Employee Retention Calculation.mp4
    13:08
  • 6. Part 3 - Employee Turnover Calculation.mp4
    08:10
  • 7. Part 4 - Visualizing Headcount.mp4
    12:59
  • 8. Part 4 - Visualizing Retention.mp4
    21:41
  • 9. Part 4 - Visualizing Turnover.mp4
    07:27
  • 10. Part 5 - Choosing a Color Palette.mp4
    15:32
  • 11. Part 5 - Designing Your Report Pages.mp4
    17:08
  • 12. Part 6 - Integrating Your Design & Data Visuals - Headcount.mp4
    31:54
  • 13. Part 6 - Integrating Your Design & Data Visuals - Retention.mp4
    24:52
  • 14. Part 6 - Integrating Your Design & Data Visuals - Turnover.mp4
    13:47
  • 15. Part 7 - Building an Interactive Slicer Panel.mp4
    15:38
  • 16. Part 7 - Building an Interactive Tooltip Page.mp4
    17:08
  • 17.1 backgrounds2.pptx
  • 17.2 hr tool completed.zip
  • 17. Part 8 - Designing a Cool Cover Page for Your Report.mp4
    15:49
  • 1.1 Winemag Dataset.pptx
  • 1.2 winemag-data-130k-v2.csv.zip
  • 1. Introduction and Kick-Off.mp4
    09:39
  • 1.1 Link to NovyPro.com.html
  • 1. Publishing Your Portfolio Pieces.mp4
    08:31
  • 2.1 Sweatpants BI on YouTube.html
  • 2. Thank You!.mp4
    01:58
  • Description


    Boost Your Power BI Career with 4 Full-Length Guided Projects

    What You'll Learn?


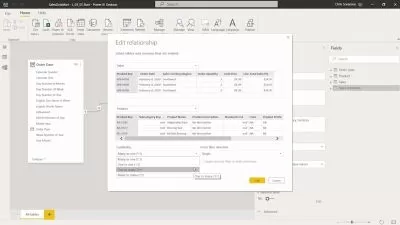
    • In this course, you will learn a variety of approaches to building Power BI reports through four full-length, guided projects.
    • You will also learn how to evaluate a dataset and how to ask the right questions that lead to designing smart, narrative-driven visualizations
    • You will also learn tons of BI design techniques, including how to build stunning tools, how to apply bookmarks, how to build tooltips, slicer panels & more
    • Finally, you will walk away with the foundation to build an impressive four-project portfolio (5 if you complete the additional dataset with guided questions)

    Who is this for?


  • Power BI learners of all levels should find something to enjoy in this course, whether you're a DAX Pro looking to boost their design skills or a total Power BI newbie looking to catch up quickly.
  • What You Need to Know?


  • Students of this class should have some exposure to Power BI and be familiar with basic Power BI concepts, like DAX, Power Query Editor, etc. I will talk about these concepts but I won't deep-dive topics not relevant to the projects being covered.
  • Students should have Power BI Desktop and, ideally, Microsoft PowerPoint already installed. A Power BI license (business or student) is helpful but won't be a huge obstacle for students looking to refine their design skills.
  • More details


    Description

    In this Sweatpants BI course, we'll cover a range of Power BI and data visualization topics through four full-length guided projects and an extra fifth project with suggested topics and business questions.  Using datasets focused on market insights, real estate, a fake Florida-based coffee chain, and more, you will gain experience performing a variety of Power Query transformations, writing various levels of DAX code, designing gorgeous Power BI reports, building impactful data visuals, and applying next-level user experience techniques.  At the end of this course, you will have a variety of new tools on hand to design a great BI portfolio to flex your data visualization and reporting skills!


    This course is designed for people with a decent foundation in Power BI.  If you're a beginner, you are more than welcome to tag along but you may find yourself lost from time to time.   Check out the Sweatpants BI course, Power Pivoting: Microsoft Power BI for Career Changers if you're new to Power BI and need more background or, based on your budget, check out the Sweatpants BI YouTube channel for some free guidance on topics like DAX and Power Query Editor.  Otherwise, if you know the ropes but are looking for some help building out your first Power BI portfolio and gaining a variety of great reporting and design techniques, look no further.  This might be the course for you!

    Who this course is for:

    • Power BI learners of all levels should find something to enjoy in this course, whether you're a DAX Pro looking to boost their design skills or a total Power BI newbie looking to catch up quickly.

    User Reviews
    Rating
    0
    0
    0
    0
    0
    average 0
    Total votes0
    Focused display
    Sean Chandler
    Sean Chandler
    Instructor's Courses
    Sean Chandler has been working professionally in business intelligence since 2014, specializing in creating solutions of all shapes and sizes on the Microsoft Power Platform.  In 2019, he joined Humana, where he currently works as a Business Intelligence Lead building a team focused on advancing clinical analytics for one of the US' largest health insurance providers.As a BI professional, Sean has delivered hundreds of Power BI projects ranging from small ad hoc solutions to enormous tools integrating tens of millions of rows of complex business data.  He has won multiple awards for his BI work and has even been featured as a presenter on Microsoft Mechanics to discuss his builds.  Over the past several years, his Power BI expertise has allowed him to teach a variety of courses on designing effective solutions and deliver multiple presentations to hundreds of aspiring BI professionalsSean's teaching experience spans more than a decade, beginning in 2010 when he spent more than a year teaching ESL in South Korea.  Since then, Sean has helped prepare dozens of Kentucky high school students for college entrance exams and delivered online curriculum & learning content for multiple platforms focused on helping others become better Power BI developers.A proud Kentuckian, Sean is a graduate of Centre College and holds a MA in International Diplomacy and MBA from the University of Kentucky.  In his spare time, Sean enjoys yoga, weightlifting, gaming, and spending quality time with his spouse.  He also loves to travel, particularly to favorite destinations like Croatia, Bosnia, South Korea, and Switzerland.  He currently resides in Louisville, Kentucky.
    Students take courses primarily to improve job-related skills.Some courses generate credit toward technical certification. Udemy has made a special effort to attract corporate trainers seeking to create coursework for employees of their company.
    • language english
    • Training sessions 91
    • duration 20:12:37
    • Release Date 2024/03/19

    Courses related to Microsoft Power BI