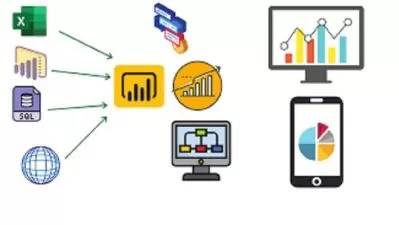
Microsoft Power BI Essentials
Simon Sez IT
1:33:13
Description
Unlock the full potential of Power BI and transform your data into actionable insights for informed decision-making.
What You'll Learn?
- Transform raw data into meaningful insights using Power BI.
- Create calculated measures to analyze data effectively.
- Establish relationships and data models for optimized organization.
- Design visually appealing data visualizations using various formatting techniques.
- Utilize filters and slicers to focus on specific data subsets.
- Publish Power BI reports from desktop to web for collaborative access.
- Utilize the "Ask Questions" function for interactive data querying.
- Share Power BI reports online through the Publish to Web feature.
Who is this for?
What You Need to Know?
More details
Description**This course includes downloadable course demo files to work with and follow along.
Welcome to the Microsoft Power BI Essentials course. Throughout this course, you'll gain a comprehensive understanding of Power BI and its essential features, empowering you to analyze and visualize data for informed decision-making effectively.
You'll start by familiarizing yourself with Power BI's interface and learn how to transform and import data from various sources. As you progress, you'll delve into creating calculations such as measures and calculated columns to derive meaningful insights from your data.
Next, you'll explore data modeling techniques, including establishing relationships and data models to optimize data organization and analysis. You'll then learn to create visually appealing and informative data visualizations, including text boxes, date visualizations, and formatting.
As we go further, you'll discover how to filter and slice data to focus on specific insights, enhancing the clarity and relevance of your visualizations. You'll also master publishing your Power BI reports and dashboards from the desktop to the web, allowing seamless collaboration and accessibility.
Finally, you'll learn how to utilize the "Ask Questions" function to interactively query your data and publish your reports to the web for broader dissemination.
By the end of the course, you should possess the skills necessary to leverage Power BI effectively, enabling you to drive data-driven decisions and enhance your analytical capabilities in various professional settings.
In this course, you will learn how to:
Transform raw data into meaningful insights using Power BI.
Create calculated measures to analyze data effectively.
Establish relationships and data models for optimized organization.
Design visually appealing data visualizations using various formatting techniques.
Utilize filters and slicers to focus on specific data subsets.
Publish Power BI reports from desktop to web for collaborative access.
Utilize the "Ask Questions" function for interactive data querying.
Share Power BI reports online through the Publish to Web feature.
This course includes:
1+ hours of video tutorials
22 individual video lectures
Course files to follow along
Certificate of completion
Who this course is for:
- Business analysts and data analysts
- Users new to Power BI and and want to improve their skills.
- Those who want to use Power BI for data visualization and analysis.
**This course includes downloadable course demo files to work with and follow along.
Welcome to the Microsoft Power BI Essentials course. Throughout this course, you'll gain a comprehensive understanding of Power BI and its essential features, empowering you to analyze and visualize data for informed decision-making effectively.
You'll start by familiarizing yourself with Power BI's interface and learn how to transform and import data from various sources. As you progress, you'll delve into creating calculations such as measures and calculated columns to derive meaningful insights from your data.
Next, you'll explore data modeling techniques, including establishing relationships and data models to optimize data organization and analysis. You'll then learn to create visually appealing and informative data visualizations, including text boxes, date visualizations, and formatting.
As we go further, you'll discover how to filter and slice data to focus on specific insights, enhancing the clarity and relevance of your visualizations. You'll also master publishing your Power BI reports and dashboards from the desktop to the web, allowing seamless collaboration and accessibility.
Finally, you'll learn how to utilize the "Ask Questions" function to interactively query your data and publish your reports to the web for broader dissemination.
By the end of the course, you should possess the skills necessary to leverage Power BI effectively, enabling you to drive data-driven decisions and enhance your analytical capabilities in various professional settings.
In this course, you will learn how to:
Transform raw data into meaningful insights using Power BI.
Create calculated measures to analyze data effectively.
Establish relationships and data models for optimized organization.
Design visually appealing data visualizations using various formatting techniques.
Utilize filters and slicers to focus on specific data subsets.
Publish Power BI reports from desktop to web for collaborative access.
Utilize the "Ask Questions" function for interactive data querying.
Share Power BI reports online through the Publish to Web feature.
This course includes:
1+ hours of video tutorials
22 individual video lectures
Course files to follow along
Certificate of completion
Who this course is for:
- Business analysts and data analysts
- Users new to Power BI and and want to improve their skills.
- Those who want to use Power BI for data visualization and analysis.
User Reviews
Rating
Simon Sez IT
Instructor's Courses
Udemy
View courses Udemy- language english
- Training sessions 23
- duration 1:33:13
- Release Date 2024/08/11


