Mastering Data Analytics and Visualisation with Python
Moe Hamdan
7:24:34
Description
From Novice to Ninja - Master Data Analytics with Python and Visualisation extract Actionable Insights from Data
What You'll Learn?
- Learn the basics of python for data analytics
- Learn how to use Numpy lists to manipulate data in lists
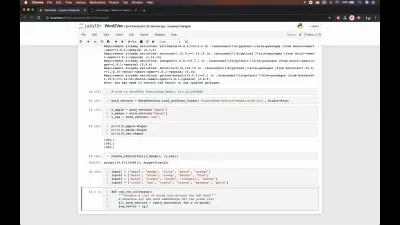
- Learn how to utilise Pandas dataframes to read data, analyse it and write it to files
- Learn how to use Matplotlib to create customisable visualisations
- Learn how to make the most out of python to extract actionable insights from their data
- Take the next step in boosting your career by learning the most powerful programming language for data analytics
Who is this for?
What You Need to Know?
More details
DescriptionUnlock the power of data analytics with Python in this comprehensive course designed to equip you with the essential skills needed to thrive in the data-driven world. Whether you're a beginner or an experienced coder, this course will empower you to harness the potential of Python for data analysis.
Key Topics Covered:
Python Basics:
Lay a solid foundation by delving into Python's fundamental concepts. You'll grasp the essentials, such as variables, data types, loops, and functions, setting the stage for more advanced data analysis techniques.
Numpy:
Explore how to leverage NumPy, a fundamental library for numerical operations in Python. Discover how to efficiently store and manipulate data arrays, enabling you to perform complex calculations effortlessly.
Pandas:
Dive into the world of Pandas, the go-to library for data manipulation and analysis. Learn to read, clean, and transform data effortlessly, and uncover the power of data frames for data representation.
Matplotlib:
Master the art of data visualization with Matplotlib. This section equips you with the skills to create stunning custom-designed visualizations, turning raw data into insightful charts and graphs.
By the end of this course, you will have the expertise to:
Use Python confidently for data analysis tasks.
Harness the capabilities of NumPy for efficient data manipulation.
Perform data analysis, cleaning, and transformation using Pandas.
Create visually appealing and customized data visualizations with Matplotlib.
Whether you are a data enthusiast, aspiring data scientist, or a professional seeking to enhance your analytical skills, this course provides a comprehensive roadmap to data analytics success with Python. Enroll now and embark on your journey to becoming a proficient data analyst with Python.
Don't miss out on this opportunity to boost your data analytics skills. Enroll today and unlock a world of data-driven insights with Python!
Who this course is for:
- Data analysts looking to learn how to utilise python to analyse data
- Data analysts who want to learn how to use python to create data visualisations
Unlock the power of data analytics with Python in this comprehensive course designed to equip you with the essential skills needed to thrive in the data-driven world. Whether you're a beginner or an experienced coder, this course will empower you to harness the potential of Python for data analysis.
Key Topics Covered:
Python Basics:
Lay a solid foundation by delving into Python's fundamental concepts. You'll grasp the essentials, such as variables, data types, loops, and functions, setting the stage for more advanced data analysis techniques.
Numpy:
Explore how to leverage NumPy, a fundamental library for numerical operations in Python. Discover how to efficiently store and manipulate data arrays, enabling you to perform complex calculations effortlessly.
Pandas:
Dive into the world of Pandas, the go-to library for data manipulation and analysis. Learn to read, clean, and transform data effortlessly, and uncover the power of data frames for data representation.
Matplotlib:
Master the art of data visualization with Matplotlib. This section equips you with the skills to create stunning custom-designed visualizations, turning raw data into insightful charts and graphs.
By the end of this course, you will have the expertise to:
Use Python confidently for data analysis tasks.
Harness the capabilities of NumPy for efficient data manipulation.
Perform data analysis, cleaning, and transformation using Pandas.
Create visually appealing and customized data visualizations with Matplotlib.
Whether you are a data enthusiast, aspiring data scientist, or a professional seeking to enhance your analytical skills, this course provides a comprehensive roadmap to data analytics success with Python. Enroll now and embark on your journey to becoming a proficient data analyst with Python.
Don't miss out on this opportunity to boost your data analytics skills. Enroll today and unlock a world of data-driven insights with Python!
Who this course is for:
- Data analysts looking to learn how to utilise python to analyse data
- Data analysts who want to learn how to use python to create data visualisations
User Reviews
Rating
Moe Hamdan
Instructor's Courses
Udemy
View courses Udemy- language english
- Training sessions 46
- duration 7:24:34
- Release Date 2023/11/20


