

About Data AnalysisLearn More
Data analytics is the practice of gathering and processing data in order to extract actionable information to help you make informed decisions. Organizations of all types are more data driven today than ever before, and the need for data analysts grows with it. Data analytics courses help you gain the information and skills you need for this exciting field.
Sort by:
Sorting
The newest
Most visited
Course time
Subtitle
Filtering
Courses
Udemy

Muhammad Dujana
Learn Statistics & Biostatistics Data Analysis From Scratch 4:32:11
03/04/2025
Subtitle

Udemy

Omolu Osivue Christopher
Master SQL and Databases in 30 Days: A Complete Guide 5:18:23
English subtitles
02/09/2025


Subtitle

Pluralsight

Janani Ravi
Data Analysis Functions and Techniques in Microsoft Excel 49:43
English subtitles
11/13/2024
![Data Science Methods and Techniques [2024]](https://traininghub.ir/image/course_pic/41595-x225.webp)


Subtitle

Linkedin Learning

Jungwoo Ryoo
Data Science and Analytics Career Paths and Certifications: First Steps 1:32:05
English subtitles
09/03/2024
Subtitle

Linkedin Learning

Annyce Davis
Android Development Essential Training: 4 Working with Data 1:49:15
English subtitles
08/29/2024


Books


Frequently asked questions about Data Analysis
Data analysis is the process of studying or manipulating a dataset to gain some sort of insight. Usually, the insight can be leveraged to inform a decision or action. It includes everything from simple math operations to complex statistical calculations. Most people conduct data analysis on a daily basis. For example, you may sort your credit card charges by the highest amount to uncover the three most expensive costs in the previous month. Or, you may calculate the average number of points your favorite athlete scored in a game to predict their performance in a future game.
To be a data analyst, you’ll need technical skills to analyze data and report insights successfully. Technical skills may include data analysis, statistical knowledge, data storytelling, communication, and problem-solving. Business intuition and strategic thinking are also useful for data analysts that often partner with business stakeholders. Data analysis involves taking a business question or need and turning it into a data question. Then you'll transform and analyze the data to extract an answer to that question. Data storytelling includes both graphing and communication skills, which means that you'll need to create graphs and charts that help communicate your data and findings visually. You also need to communicate clearly in multiple formats, which may include strong writing, speaking, explaining, and listening skills. Problem-solving skills are useful because they help you do things like create innovative approaches to overcome challenges and resolve issues with data gaps.
Data analysts are in every industry, and their job titles can vary. Typical sectors include (but are not limited to) retail, healthcare, banking and finance, transportation, education, construction, and technology. Types of jobs that require knowledge of data analytics include Data Scientists, Business Intelligence Analyst, Data Engineer, Quantitative Analyst, Data Analytics Consultant, Operations Analyst, Marketing Analyst, Project Manager, IT Systems Analyst, and Transportation Logistics Specialist. Data Scientist roles typically earn higher salaries. Specific data scientist jobs include Machine Learning Engineer, Machine Learning Scientist, Applications Architect, Enterprise Architect, Data Architect, Infrastructure Architect, Data Engineer, and Statistician.
Data analysis can mean different things depending on the person, company, or industry. The amount of time it takes to learn data analysis skills depends on the complexity of the problem you’re trying to solve as well as your prior experience. Basic operations like using Excel to sort or filter data take a few hours to learn. In comparison, complex analyses involving advanced disciplines like statistics, machine learning, or natural language processing can take months or years to master. It’s helpful to consider the amount of practice needed to learn data analysis, rather than a set timeframe. First, identify the problem you’re trying to solve with data analysis, and let that guide you to the right tool or subject matter. Then, practice until you’re ready to proceed to a more advanced topic.
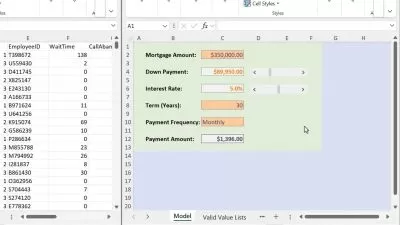
Data analysis in spreadsheet software like Microsoft Excel does not require coding. Analysts can execute their logic in a graphical user interface using basic mouse clicks. But, programming tends to become a natural pursuit for data analysts. Coding enables repetition and automation, which are helpful features for analysis following consistent rules, like a weekly report. Many programming languages are useful for data analysis, each with their own strengths and weaknesses. Excel is an excellent entry point for learning how to think like a developer. Spreadsheet functions like VLOOKUP, SUMIF, and COUNTA need similar logic to what a software program demands.
The most popular data analysis tool in use today is Microsoft’s Excel spreadsheet software. Other alternatives to Excel include Google Sheets and Apple Numbers. Analysts often progress to working with programming languages as business analysis needs scale. Python and its ecosystem of visualization tools are popular among data analysts and data scientists. The statistical programming language R is another common option for data needs. Additional choices include Java, Scala, MATLAB, and SAS. It’s important to recognize that each language has its own strengths and weaknesses. There is no single best language. Rather, languages are different tools to add to your toolbox over time. Solving problems in any language will help improve your general data analysis skills. If you’re uncertain about which technology to start with, pick one language, and practice it for a while.
As long as we keep generating data, there will be a demand for data analysts. The fast evolution of technology and the internet has generated massive amounts of data in the past couple of decades. This data is increasing dramatically as time goes on. First, it was only computers that connected to the internet and then cellphones. And now, with the Internet of Things, many devices — from lightbulbs to entry locks — connect to the internet and generate data. Every web and phone application generates data, from Google search to Instagram. Businesses rely on this type of data to make informed decisions about the future of their business. To get this type of information from terabytes of raw data, they need people who have the skills to pull answers from it.
Data analysis and data science both deal with data. The difference is in what they do with it. Data analysts examine enormous data sets to identify trends, design charts, and create presentations to help a business make strategic decisions about the future. They use data to draw insights and solve problems. For example, a company would look to their data analyst to answer the question, "Why did sales decrease last quarter?" The analyst would respond using the data available to them. On the other hand, data scientists design and build new processes for data and predictive modeling. This requires knowledge of artificial intelligence, or machine learning, that can predict a business's future. Still, there are quite a few data roles where the line between data analysis and data science is not well-defined. Many successful data professionals seek out online courses like Udemy's to become cross-disciplined across the two.