Mastering AI and Data Analysis no Coding with JMP Software
Swapnil Saurav
4:18:18
Description
Unleashing the Power of Statistical Discovery and Visualization
What You'll Learn?
- Learners will be able to navigate and utilize the various features and functions available in JMP software effectively.
- Learners will gain a thorough understanding of data analysis techniques and how to apply them using JMP software.
- Learners will be able to interpret and visualize data using graphs, charts, and other graphical representations within JMP software.
- Learners will develop the skills and knowledge necessary to effectively present and communicate their findings and results using JMP software.
- Learners will develop the skills to effectively analyze and interpret data using statistical modeling and predictive analytics tools in JMP software.
Who is this for?
What You Need to Know?
More details
DescriptionHello. My name is Swapnil Saurav and I Welcome you to my comprehensive training course on JMP software! JMP is a powerful statistical analysis tool that provides users with the ability to explore and visualize data, create predictive models, and make data-driven decisions.
Throughout this training, you will learn how to utilize the various features and functions of JMP to analyze data from a wide range of industries and disciplines. Whether you are a beginner or an experienced user, this course is designed to equip you with the knowledge and skills necessary to leverage JMP effectively.
We will start by introducing you to the JMP interface, navigating the different menus and windows, and customizing your workspace to suit your needs. From there, we will delve into the various data import options available in JMP, including importing data from Excel, CSV files, and databases.
Next, we will explore the data manipulation capabilities of JMP, such as sorting, filtering, and transforming data. You will learn how to create and edit formulas, perform calculations, and identify missing values or outliers in your data.
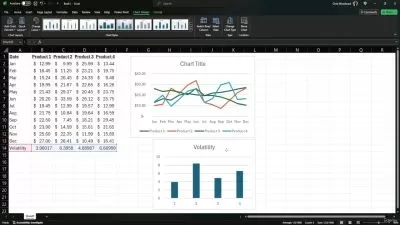
Once you have a clean and organized dataset, we will move on to exploring and visualizing your data. You will discover how to create informative graphs, charts, and plots, as well as perform basic and advanced statistical analyses using JMP's extensive library of statistical tools.
Additionally, we will cover the basics of predictive modeling in JMP, including building and evaluating regression models, classification models, and decision trees. You will learn how to select the appropriate model, assess its quality, and interpret the results.
I have also included short module on statistics both descriptive and inferential types which will help you to understand the concepts behind the analytics and the models.
By the end of this training, you will have a strong foundation in using JMP software for data analysis and visualization. Whether you are a researcher, analyst, or decision-maker, the skills acquired in this course will enable you to unlock the full potential of your data and make data-driven decisions with confidence.
So let's dive in and start exploring the incredible capabilities of JMP software!
Who this course is for:
- Scientists and Researchers: JMP software is designed to aid in data analysis and visualization, making it an excellent tool for scientists and researchers who need to analyze large datasets and extract meaningful insights. It can help them identify patterns, trends, and outliers in their data, and facilitate data-driven decision-making.
- Business Analysts: Business analysts often work with complex data from various sources, such as sales, marketing, and customer data. JMP software can assist them in organizing and analyzing this data to derive insights that can drive strategic decision-making for the company. It provides robust statistical tools, predictive modeling capabilities, and data visualization options that can help them communicate findings effectively.
- Quality Control Professionals: Those working in quality control and process improvement can benefit greatly from learning JMP software. It provides tools for statistical process control, design of experiments, and root cause analysis, enabling them to identify and mitigate quality issues, optimize processes, and improve overall product quality.
- Engineers and Technicians: Engineers and technicians tasked with analyzing and optimizing engineering processes can benefit from learning JMP software. It provides tools for design of experiments, statistical analysis, and modeling, allowing them to identify factors influencing performance, optimize processes, and troubleshoot issues. JMP can also aid in visualizing and communicating results with stakeholders, making it a valuable tool in engineering fields.
- Students and Educators: JMP software can be an excellent learning tool for students studying statistics, data science, or any field that heavily relies on data analysis. By learning JMP, students can gain practical experience with statistical analysis, data visualization, and other essential data analysis techniques. Educators can also use JMP software to facilitate hands-on learning and engage students in real-world data analysis projects.
Hello. My name is Swapnil Saurav and I Welcome you to my comprehensive training course on JMP software! JMP is a powerful statistical analysis tool that provides users with the ability to explore and visualize data, create predictive models, and make data-driven decisions.
Throughout this training, you will learn how to utilize the various features and functions of JMP to analyze data from a wide range of industries and disciplines. Whether you are a beginner or an experienced user, this course is designed to equip you with the knowledge and skills necessary to leverage JMP effectively.
We will start by introducing you to the JMP interface, navigating the different menus and windows, and customizing your workspace to suit your needs. From there, we will delve into the various data import options available in JMP, including importing data from Excel, CSV files, and databases.
Next, we will explore the data manipulation capabilities of JMP, such as sorting, filtering, and transforming data. You will learn how to create and edit formulas, perform calculations, and identify missing values or outliers in your data.
Once you have a clean and organized dataset, we will move on to exploring and visualizing your data. You will discover how to create informative graphs, charts, and plots, as well as perform basic and advanced statistical analyses using JMP's extensive library of statistical tools.
Additionally, we will cover the basics of predictive modeling in JMP, including building and evaluating regression models, classification models, and decision trees. You will learn how to select the appropriate model, assess its quality, and interpret the results.
I have also included short module on statistics both descriptive and inferential types which will help you to understand the concepts behind the analytics and the models.
By the end of this training, you will have a strong foundation in using JMP software for data analysis and visualization. Whether you are a researcher, analyst, or decision-maker, the skills acquired in this course will enable you to unlock the full potential of your data and make data-driven decisions with confidence.
So let's dive in and start exploring the incredible capabilities of JMP software!
Who this course is for:
- Scientists and Researchers: JMP software is designed to aid in data analysis and visualization, making it an excellent tool for scientists and researchers who need to analyze large datasets and extract meaningful insights. It can help them identify patterns, trends, and outliers in their data, and facilitate data-driven decision-making.
- Business Analysts: Business analysts often work with complex data from various sources, such as sales, marketing, and customer data. JMP software can assist them in organizing and analyzing this data to derive insights that can drive strategic decision-making for the company. It provides robust statistical tools, predictive modeling capabilities, and data visualization options that can help them communicate findings effectively.
- Quality Control Professionals: Those working in quality control and process improvement can benefit greatly from learning JMP software. It provides tools for statistical process control, design of experiments, and root cause analysis, enabling them to identify and mitigate quality issues, optimize processes, and improve overall product quality.
- Engineers and Technicians: Engineers and technicians tasked with analyzing and optimizing engineering processes can benefit from learning JMP software. It provides tools for design of experiments, statistical analysis, and modeling, allowing them to identify factors influencing performance, optimize processes, and troubleshoot issues. JMP can also aid in visualizing and communicating results with stakeholders, making it a valuable tool in engineering fields.
- Students and Educators: JMP software can be an excellent learning tool for students studying statistics, data science, or any field that heavily relies on data analysis. By learning JMP, students can gain practical experience with statistical analysis, data visualization, and other essential data analysis techniques. Educators can also use JMP software to facilitate hands-on learning and engage students in real-world data analysis projects.
User Reviews
Rating

Swapnil Saurav
Instructor's Courses
Udemy
View courses Udemy- language english
- Training sessions 52
- duration 4:18:18
- Release Date 2024/04/13