Learning Data Visualization
Focused View
Bill Shander
3:49:33
220 View
01 - Welcome.mp4
00:51
01 - 4x4 model for knowledge content.mp4
05:22
02 - Channel your audience.mp4
06:58
03 - So what is data visualization.mp4
07:33
04 - ASK what makes a good data visualization.mp4
04:34
05 - Visual perception.mp4
06:19
06 - Understanding your data.mp4
10:52
01 - Explanatory.mp4
04:01
02 - The six Ws.mp4
05:08
03 - Three more Ws.mp4
05:22
04 - Explore your data Visual exploration.mp4
08:43
05 - Explore your data Indexes and ratios.mp4
04:46
06 - Convert your data Indexes and ratios.mp4
08:07
07 - Convert your data Percentiles.mp4
04:47
08 - Convert your data Aggregating.mp4
02:20
09 - Convert your data Grouping.mp4
03:54
10 - Convert your data Data formats.mp4
02:41
01 - Sketches and wireframes.mp4
05:51
01 - Defining your narrative.mp4
08:00
02 - Making everything relatable.mp4
05:35
01 - Illustration and iconography.mp4
04:00
02 - Typography.mp4
08:36
03 - Position, size, color, contrast, and shape.mp4
12:42
04 - The importance of scale.mp4
07:18
05 - Legends and sources.mp4
04:43
06 - The right paradigm Basic charts.mp4
07:43
07 - The right paradigm Alternative charts.mp4
07:40
08 - The right paradigm Hierarchical data.mp4
08:45
09 - The right paradigm Maps.mp4
09:43
10 - The right paradigm Creativity and innovation.mp4
09:33
11 - Challenge Improving on The perfect report.mp4
04:14
12 - Solution Improving on The perfect report.mp4
04:01
01 - Introducing motion.mp4
05:58
02 - When to go interactive.mp4
05:56
03 - How to think interactively.mp4
09:55
04 - Finding the right technology.mp4
06:03
01 - Next steps.mp4
00:59
Ex_Files_Learning_Data_Visualization.zip
Glossary_Learning_Data_Visualization.zip
Description
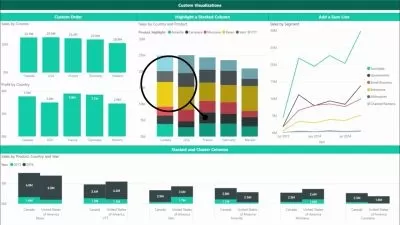
Got a big idea? You need to get it across quickly and efficiently, or modern audiences will move on to the next story clamoring for their attention. Data visualization allows you to make the complex simple, the abstract tangible, and the invisible visible. In this course, Bill Shander shows how to think about your data, your audience, and your goals to create visuals that maximize impact. Plus, learn about human visual perception and chart selection strategies, which make all the difference when visualizing data.
More details
User Reviews
Rating
average 0
Focused display
Category

Bill Shander
Instructor's CoursesData storytelling, information design and data visualization combine three distinct parts of me - the journalist, the designer and the technologist.
I speak at conferences and lead in-person workshops for clients and the public on data storytelling and visualization - why it's essential in today's world and how to really communicate effectively with varied audiences.
I also work with clients, and love listening to their challenges, exploring their data and processes and helping them deliver compelling messages via interactive and static visual experiences. Clients include various US Government agencies, United Nations, World Bank, PricewaterhouseCoopers, Starbucks, American Express, and many other world-renowned organizations.

Linkedin Learning
View courses Linkedin LearningLinkedIn Learning is an American online learning provider. It provides video courses taught by industry experts in software, creative, and business skills. It is a subsidiary of LinkedIn. All the courses on LinkedIn fall into four categories: Business, Creative, Technology and Certifications.
It was founded in 1995 by Lynda Weinman as Lynda.com before being acquired by LinkedIn in 2015. Microsoft acquired LinkedIn in December 2016.
- language english
- Training sessions 37
- duration 3:49:33
- Release Date 2023/01/03