About Excel DashboardLearn More
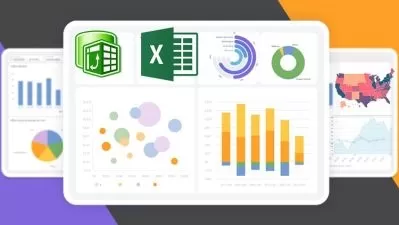
An Excel dashboard is usually prepared on one page and allows managers and business leaders to monitor key performance indicators and make decisions based on it. Dashboards contain a variety of charts, tables, and tools that display data.
The first thing you need to do after receiving the data (or even before) is to identify the exact purpose of the dashboard and know what the stakeholder wants.
Sort by:
Sorting
The newest
Most visited
Course time
Subtitle
Filtering
Courses
![[3-in-1] Data Viz Bundle: Tableau, Excel & Looker Studio](https://traininghub.ir/image/course_pic/14000-x225.webp)
Udemy

Start-Tech Academy
[3-in-1] Data Viz Bundle: Tableau, Excel & Looker Studio 17:41:39
06/05/2023
Subtitle

Udemy

Dave Murphy
77-728 Microsoft Excel 2016 Expert Certification 9:49:54
English subtitles
05/30/2023
Subtitle

Udemy
Dave Murphy
77-727 Microsoft Excel 2016 Core Certification 7:29:55
English subtitles
05/30/2023
Subtitle
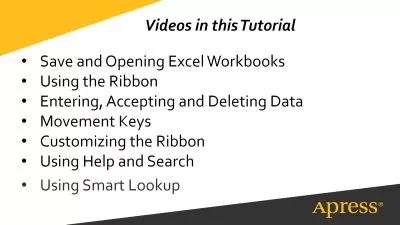
APressExcel Essentials for Entering Data, Accepting Data, Deleting Data, and More Covering Excel 2019 and Microsoft 365
58:46
English subtitles
05/28/2023


Udemy

Ismaila Mumin Omeiza
Advanced Microsoft Interactive and Dynamic Excel Dashboard 13:34:26
04/18/2023

Subtitle

Udemy
Leonardo Adonis
Grafana (2023): Complete Dashboards + Monitoring 2:04:33
English subtitles
04/01/2023