About Excel DashboardLearn More
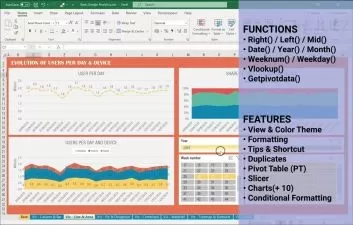
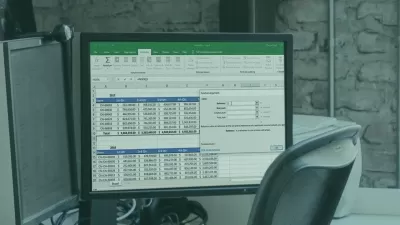
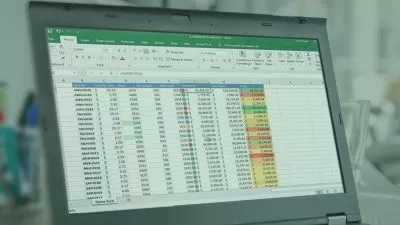
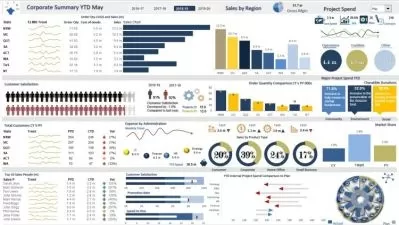
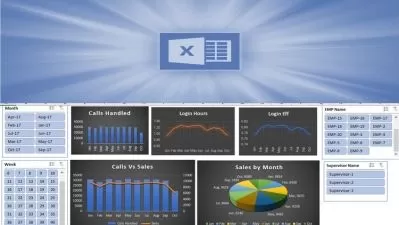
An Excel dashboard is usually prepared on one page and allows managers and business leaders to monitor key performance indicators and make decisions based on it. Dashboards contain a variety of charts, tables, and tools that display data.
The first thing you need to do after receiving the data (or even before) is to identify the exact purpose of the dashboard and know what the stakeholder wants.
Sort by:
Sorting
The newest
Most visited
Course time
Subtitle
Filtering
Courses


Subtitle

Pluralsight

Pratheerth Padman
Searching and Manipulating Data in Excel 2016 1:11:18
English subtitles
10/06/2023


Udemy

The Dronaachaarya
Visually Stunning Microsoft Excel Dynamic Dashboard Course 6:46:14
08/22/2023


Subtitle

Udemy

Kadhiravan Jayachandiran
Excel Dashboarding for 2023 | Visually Stunning Dashboards 2:00:31
English subtitles
08/07/2023
Subtitle

Udemy

Vivek PMP
Complete Microsoft Advanced Excel Certification 9:14:05
English subtitles
08/06/2023
Subtitle

Linkedin Learning

Jordan Goldmeier
Excel: Mastering Pivot Table Dashboards and Reports 1:16:50
English subtitles
07/26/2023