About Excel ChartsLearn More
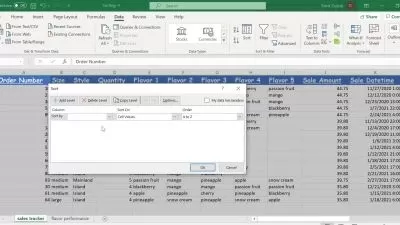
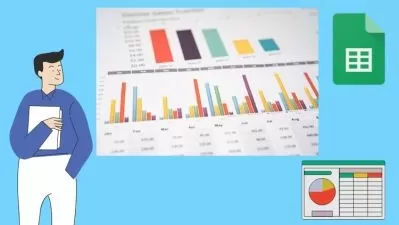
Charts and graphs help to make a visual effect of the data in the Excel file. The terms diagram and graph are generally used together and sometimes interchangeably. In general, graph can be considered as the most basic method for visual display of data that displays data values in a time period. Charts have a more complex structure and somehow make it easier to compare two types of data.
Sort by:
Sorting
The newest
Most visited
Course time
Subtitle
Filtering
Courses


Subtitle

Udemy

Vivek PMP
Complete Microsoft Advanced Excel Certification 9:14:05
English subtitles
08/06/2023


Subtitle

Linkedin Learning

Joshua Rischin
Learning Excel Online (Microsoft 365) 1:13:43
English subtitles
07/16/2023


CBT Nuggets

Jonathan Barrios
Excel 2022 for Data Analysis: Beginners Online Training 4:31:46
06/21/2023


Udemy

Mohammad Parwez
Quickly Learn Excel Power Query and Power Pivot with example 1:42:51
06/19/2023
Subtitle

Udemy

Dave Murphy
MO-201 Complete Techniques for the MOS Excel Expert Exam 7:34:41
English subtitles
06/14/2023
Subtitle

Udemy
Dave Murphy
MO-200 Microsoft Excel 365/2019 Associate Certification 6:34:20
English subtitles
06/14/2023