Data Visualization with Bokeh
Focused View
Ken W. Alger
1:01:03
71 View
S1V1_1Course Introduction.mp4
04:10
S1V2Getting Started with Bokeh.mp4
06:32
S1V3_V2Bokeh's ColumnDataSource.mp4
10:23
S1V4Colors and Legends.mp4
06:13
S2V1Hover Tools.mp4
05:30
S2V2Linking Data.mp4
11:40
S2V3Plotting the World.mp4
16:35
Description
About this Course
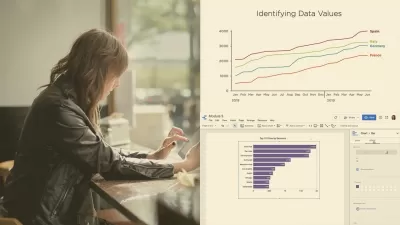
Learn how to use the Bokeh library to generate interactive charts, graphs, and other visualizations using Python. We'll explore a world population data set and see how to generate different charts using this powerful library.
What you'll learn
- Bokeh library
- ColumnDataSource
- Chart Legends and HoverTools
- Interactivity with charts
More details
User Reviews
Rating
average 0
Focused display
Category
Ken W. Alger
Instructor's CoursesKen has a long history around computers starting with early Commodore PETs and VIC-20s. He enjoys discussing programming and how to get started in the tech industry and is a MongoDB Certified Developer.
He lives in Oregon with his wife and three children. He can be found most places online @kenwalger.

Treehouse
View courses TreehouseTreehouse or is an online technology school that offers beginner to advanced courses in web design, web development, mobile development and game development. Its courses are aimed at beginners looking to learn computer coding skills for a career in the tech industry.
- language english
- Training sessions 7
- duration 1:01:03
- Release Date 2023/04/11


