Data Visualization Foundations
Focused View
Anwar Montasir
58:30
141 View
01 What is Data Visualization.mp4
05:33
02 Before You Begin Preparing Your Story.mp4
06:00
03 Before You Begin Preparing Your Data.mp4
03:32
04 Bar Charts.mp4
04:22
05 Histograms.mp4
02:21
06 Pie charts.mp4
04:16
07 Line and Area Charts.mp4
06:17
08 Scatter Plots.mp4
04:25
09 Maps.mp4
04:02
10 Sketching.mp4
04:45
11 Accessible Visualizations.mp4
07:09
12 Ethical Visualizations.mp4
05:48
Description
About this Course
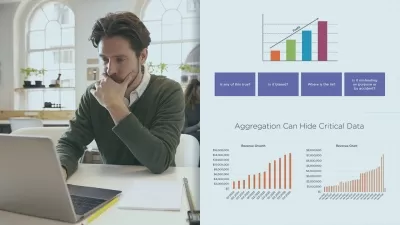
What is data visualization? A simple answer might be something like the graphic representation of data. But to get a better understanding of what practitioners of data visualization do, let’s start with the term data. By data, I mean raw, unorganized facts and numbers.
Practitioners of data visualization take raw, hard to grasp data and turn that data into information by providing context and a purpose.
What you'll learn
- Define Data Visualization
- Describe the difference between data and information
- Recall that data visualization should tell a story and help users make decisions
- List a number of charts and visualizations and describe their uses
- Recall that data should be double-checked for accuracy
- Recall that visualizations should never distort data
- Recall that visualizations should never communicate using only color
More details
User Reviews
Rating
average 0
Focused display
Category

Anwar Montasir
Instructor's CoursesAnwar Montasir has been a UX Design, Front End Web Development, and Full Stack JavaScript instructor at Treehouse.

Treehouse
View courses TreehouseTreehouse or is an online technology school that offers beginner to advanced courses in web design, web development, mobile development and game development. Its courses are aimed at beginners looking to learn computer coding skills for a career in the tech industry.
- language english
- Training sessions 12
- duration 58:30
- English subtitles has
- Release Date 2023/04/13