Data Visualization Essentials with Plotly and Python
Andrei Dumitrescu
1:35:43
Description
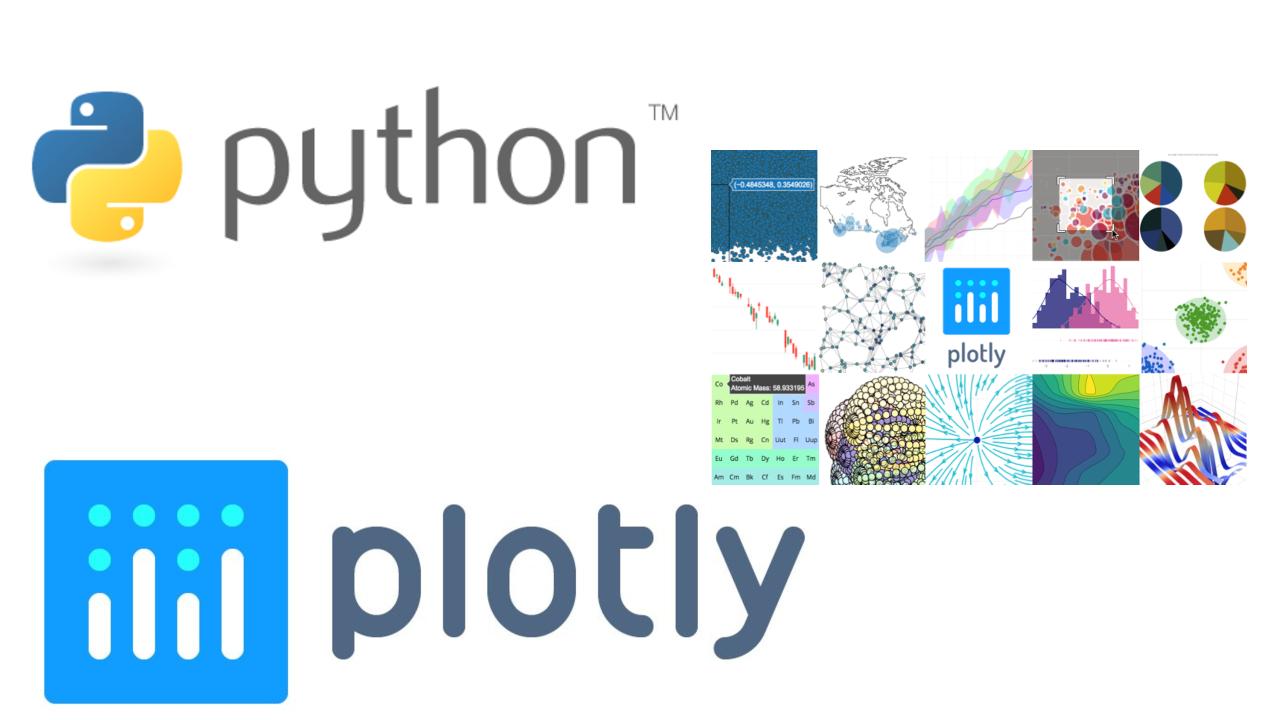
Data Visualization Essentials with Plotly and Python introduces you to the popular Plotly library for Python.
In this course you'll learn how to create interactive plots with Plotly and Python. This is one of the most in demand skills required for a data science career path!
This goal of this course is to bring your Data Visualization Skills to the next level to build your career in Data Science, Finance or Business Analytics.
Since this is intermediate Python you are required to already master the basics of Python before enrolling into this class. Some basic knowledge of Pandas, the most used Python Library for Data Science is also required. Once you have a grasp on Python and Pandas Basics, you can move on to Plotly.
My advice is to first check my other classes on Python and Pandas published here on SkillShare; they will help you build a strong foundation of Python Programming Language.
In this course we'll get the skills to get ahead!
Major topics of this course:
- Installing and Using Jupyter Notebook.
- Installing Plotly in Python 3
- Creating Scatter Plots
- Creating Line Charts
- PROJECT: Line Charts for Ethereum and
Tesla Stock Price - PROJECT SOLUTION: Line Charts for
Ethereum and Tesla Stock Price - Creating Basic Bar Charts
- Creating Basic Bar Charts
- Creating Pie Charts
- Creating Histograms
and more!
What You'll Learn?
- Technology
- Data Visualization
- Python
- Data Science
- Plotly
- Data Science Careers
More details
User Reviews
Rating
Andrei Dumitrescu
Instructor's CoursesI've been a Network and Software Engineer for over 15 years, the typical profile of a DevOps Engineer.
I've cofounded Crystal Mind Academy, a Cisco Academy and professional training center in Romania, that focuses on teaching cutting-edge technologies to students.
I have contributed to education in areas of programming, information security and operating systems. During the last 12 years more than 20,000 thousand students have participated in-person or online training programs at Crystal Mind Academy.
I have developed documentation, labs and case studies for many training programs such as Cisco CCNA, CCNA Security, CCNP, Linux Administration, Information Security, Python Programming, Network Automation with Python or Blockchain Programming (Ethereum/Solidity) which have been successfully attended by thousands over the years.
When I'm not working, I crossfit, read a good book, enjoy a good time or travel with my wife and children.

SkillShare
View courses SkillShare- language english
- Training sessions 13
- duration 1:35:43
- Release Date 2023/02/26


