Companies Home Search Profile

Data Analytics Using Python Visualizations

Focused View

Manas Dasgupta

6:26:50

161 View
  • 00001 Promotional Video.mp4
    01:57
  • 00002 Author Introduction.mp4
    01:15
  • 00003 What You Will Learn.mp4
    03:17
  • 00004 Visualization Concepts.mp4
    07:17
  • 00005 Introduction to Matplotlib.mp4
    20:03
  • 00006 Creating Simple Plots Using Matplotlib.mp4
    20:22
  • 00007 Creating Scatter Plots.mp4
    06:28
  • 00008 Creating Axis Limits.mp4
    07:34
  • 00009 Parameterizing Plots.mp4
    09:05
  • 00010 Creating Error Bars.mp4
    07:15
  • 00011 Plotting Histograms and Box Plots.mp4
    23:22
  • 00012 Plotting 2D Histograms.mp4
    10:42
  • 00013 Marginal Histograms and Marginal Boxplots.mp4
    14:20
  • 00014 Working with Subplots.mp4
    09:44
  • 00015 Stock Trend Time Series Plot and Annotations.mp4
    08:18
  • 00016 Plotting Images and Clustering.mp4
    18:51
  • 00017 Creating 2D Contour plots for 3D Data.mp4
    07:20
  • 00018 Creating 3D Plots Including 3D Contours.mp4
    06:57
  • 00019 Stylesheets rcParam and Custom Stylesheets.mp4
    06:33
  • 00020 Single and Multiple Bar Charts.mp4
    15:04
  • 00021 Area and Stacked-Area Charts.mp4
    08:17
  • 00022 Drawing Pie Charts.mp4
    10:19
  • 00023 Bubble Charts with Vectorization of Properties.mp4
    08:30
  • 00024 Plotting Regression Lines with OLS ML.mp4
    11:52
  • 00025 Categorical Variables and Histograms with EDA.mp4
    11:53
  • 00026 Seaborn Boxplot Violin plot Categorical Scatterplot.mp4
    10:17
  • 00027 Seaborn Slopeplots for Comparing Distributions.mp4
    09:13
  • 00028 Dumbbell Plot for Category-Wise Value Movement.mp4
    07:57
  • 00029 Creating Heatmaps.mp4
    08:02
  • 00030 Working with Pairplots.mp4
    06:57
  • 00031 Seasonal Trendcharts.mp4
    06:06
  • 00032 Yearplot and Calendarplot for Color-Scaled Trends.mp4
    08:38
  • 00033 Radarplot to Compare Scores of Multiple Parameters.mp4
    08:12
  • 00034 Introduction to Bokeh.mp4
    08:33
  • 00035 Creating Simple and Multiple Line Plots.mp4
    06:18
  • 00036 Customizing Your Plots.mp4
    02:49
  • 00037 Creating Bubble Plots Vectorizing Your Plot.mp4
    04:57
  • 00038 Working with Layouts Row Column Grid.mp4
    06:26
  • 00039 Using the ColumnDataSource Object.mp4
    03:57
  • 00040 Applying Filters IndexFilter BooleanFilter GroupFilter.mp4
    13:55
  • 00041 Widgets Dynamic Plot Controls.mp4
    09:57
  • 00042 Plotting on a Google Map Using Google Map API.mp4
    07:06
  • 00043 Closing Notes.mp4
    00:55
  • Data-Analytics-using-Python-Visualizations-main.zip
  • Description


    If you are working on machine learning projects and want to find patterns and insights from your data on your way to building models, then this course is for you. This course takes a holistic approach to teach visualization techniques.

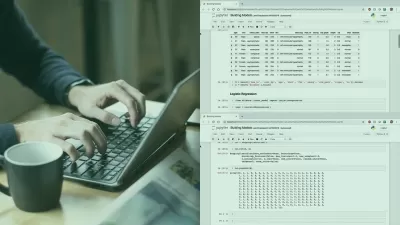
    We will be taking real-life business scenarios and raw data to go through detailed Exploratory Data Analysis (EDA) techniques to prepare the raw data to suit the appropriate visualization needs. You will learn about data analytics and exploratory data analysis techniques using multiple different data structures with NumPy and Pandas libraries. You will also learn various chart/graph types, customization/configuration, and vectorization techniques.

    We will look at advanced visualizations using business applications such as single and multiple bar charts, pie charts, and bubble charts with the vectorization of properties. We will further explore Seaborn Boxplot, Violin plot, Categorical Scatterplot, and how to create heat maps.

    By the end of the course, you will learn the foundational techniques of data analytics and deeper customizations on visualizations. You will be able to confidently use Python visualization libraries such as Matplotlib, Seaborn, and Bokeh in your future projects.

    All resources and code files are placed here: https://github.com/PacktPublishing/Data-Analytics-using-Python-Visualizations

    More details


    User Reviews
    Rating
    0
    0
    0
    0
    0
    average 0
    Total votes0
    Focused display
    Manas Dasgupta
    Manas Dasgupta
    Instructor's Courses
    Manas Dasgupta holds a master’s degree (MSc) from the Liverpool John Moore’s University (LJMU), the UK in Artificial Intelligence and Machine Learning (AI/ML). My specialization and research areas are Natural Language Processing (NLP) using Deep Learning Methods such as Siamese Networks, Encoder-Decoder techniques, various Language Embedding methods such as BERT, and areas such as Supervised Learning on Semantic Similarity and so on. His expertise area also encompasses an array of Machine Learning and Data Science / Predictive Analytics areas including various Supervised, Unsupervised, and Clustering methods. He has almost 20 Years of experience in the IT Industry, mostly in the Financial Services domain. Starting as a Developer to being an Architect for several years to a leadership position. His key focus and passion are to increase technical breadth and innovation.
    Packt is a publishing company founded in 2003 headquartered in Birmingham, UK, with offices in Mumbai, India. Packt primarily publishes print and electronic books and videos relating to information technology, including programming, web design, data analysis and hardware.
    • language english
    • Training sessions 43
    • duration 6:26:50
    • Release Date 2023/02/06