Companies Home Search Profile

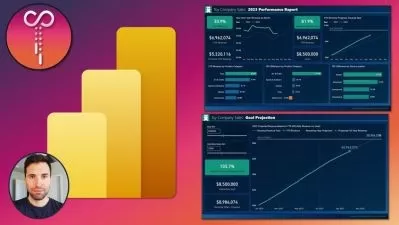
Creating Dashboards with Power BI

Focused View

Matthew Calderwood

4:04:17

65 View
  • 01 - Course Overview.mp4
    01:45
  • 02 - Introduction.mp4
    01:14
  • 03 - Reports and Dashboards - The Differences.mp4
    02:18
  • 04 - Why Use Dashboards.mp4
    03:59
  • 05 - Dashboard Navigation and External Content.mp4
    03:33
  • 06 - Power BI Workspaces.mp4
    04:07
  • 07 - Demo - Creating and Populating a Workspace.mp4
    06:37
  • 08 - Demo - Creating Dashboards.mp4
    03:17
  • 09 - Summary.mp4
    01:17
  • 10 - Introduction.mp4
    00:53
  • 11 - Design Consistency and Language.mp4
    02:58
  • 12 - Emphasizing Importance and Handling Timescales.mp4
    02:43
  • 13 - Predictable Chart Axis and Using Colours with Purpose.mp4
    03:02
  • 14 - Organizing Layouts.mp4
    02:58
  • 15 - Examples - Consistent Language and Emphasising Importance.mp4
    04:40
  • 16 - Examples - Clear Timescales and Predictable Axis Scale.mp4
    05:02
  • 17 - Examples - Use of Colors.mp4
    03:55
  • 18 - Examples - Layout Options.mp4
    04:49
  • 19 - What About My Existing Reports.mp4
    01:28
  • 20 - Demo - Customising Dashboard Content Using Existing Reports.mp4
    06:50
  • 21 - Summary.mp4
    01:16
  • 22 - Introduction.mp4
    00:55
  • 23 - Understanding Dashboard Tile Behaviors.mp4
    02:35
  • 24 - Dashboard Tile Caching.mp4
    02:42
  • 25 - Tile Configuration Options.mp4
    02:03
  • 26 - Demo - Tile Configuration.mp4
    05:53
  • 27 - Demo - Live Pages.mp4
    03:29
  • 28 - Demo - Tile Navigation and Refresh Times.mp4
    04:34
  • 29 - Demo - Building Mobile Dashboards.mp4
    06:17
  • 30 - Summary.mp4
    01:10
  • 31 - Introduction.mp4
    01:21
  • 32 - Why Use Media Tiles.mp4
    01:35
  • 33 - Media Tile Options and Behaviors.mp4
    03:44
  • 34 - Demo - The TextBox Tile.mp4
    05:28
  • 35 - Demo - The Image Tile.mp4
    03:59
  • 36 - Demo - The Video Tile.mp4
    03:04
  • 37 - Demo - The Web Content Tile.mp4
    04:25
  • 38 - Demo - Creating the Globomantics Home Page.mp4
    05:11
  • 39 - Summary.mp4
    01:13
  • 40 - Introduction.mp4
    01:14
  • 41 - Understanding Theme Behaviors.mp4
    04:28
  • 42 - Overriding Theme Colors.mp4
    02:38
  • 43 - Overriding Visual Settings.mp4
    06:11
  • 44 - Demo - Applying Themes to Dashboards.mp4
    06:46
  • 45 - Demo - Overriding Visual Settings.mp4
    04:40
  • 46 - Demo - Additional Theme Options.mp4
    05:39
  • 47 - Summary.mp4
    01:02
  • 48 - Introduction.mp4
    01:19
  • 49 - Updating Dashboard Tiles.mp4
    02:49
  • 50 - Duplicating Dashboards.mp4
    05:59
  • 51 - Demo - Observing Changes.mp4
    04:34
  • 52 - Demo - Handling Changes with Versioning.mp4
    03:46
  • 53 - Summary.mp4
    00:53
  • 54 - Introduction.mp4
    01:06
  • 55 - Row Level Security in Dashboards.mp4
    04:23
  • 56 - Demo - Adding Security Rules.mp4
    06:14
  • 57 - Demo - User Permissions and the Tile Cache.mp4
    03:06
  • 58 - Demo - Dynamic RLS in the Globomantics Dashboards.mp4
    04:13
  • 59 - Summary.mp4
    01:00
  • 60 - Introduction.mp4
    01:25
  • 61 - Optional Dashboard Features.mp4
    04:12
  • 62 - Alerts and Subscriptions.mp4
    04:24
  • 63 - Sharing Dashboards and Creating Apps.mp4
    05:28
  • 64 - Demo - Exporting Data and Using Comments.mp4
    04:20
  • 65 - Demo - Using Q A and Insights.mp4
    04:01
  • 66 - Demo - Configuring Alerts and Subscriptions.mp4
    05:39
  • 67 - Demo - Sharing Directly from the Dashboard.mp4
    04:31
  • 68 - Demo - Creating Apps.mp4
    04:46
  • 69 - Demo - Installing and Updating Apps.mp4
    03:31
  • 70 - Summary.mp4
    01:41
  • File.zip
  • Description


    This course will teach you how Power BI Dashboards can really enhance your reporting solutions, covering everything from planning and design, through to securing data, and content distribution. All with a focus on building great end-user experiences.

    What You'll Learn?


      So, you have cleaned your data, designed your data models, and built some reports. You’re now ready to deliver this content to users… but have you considered what dashboards have to offer? Power BI Dashboards are a unique and effective way of providing users quick and easy access to the data that is most important to them! This can be done in a way that not only enhances the reports that you have already written, but also improves the way that users interact with your reporting content. In this course, Creating Dashboards with Power BI, you will gain the ability to design, build, and deliver dashboard-based reporting solutions. First, you will understand the use-cases for dashboards, and learn how to make your report visualizations ‘dashboard ready’, whilst also learning some design principles that will help make your dashboards look clean, modern, and easy for users to read. Next, you will discover how you can go beyond standard report visualizations and enhance your dashboards with media tiles, including how you can even use custom web content to create integrations with sources outside of Power BI. Finally, you will explore how to manage and secure your dashboards, before going though the various options for sharing your new content with your users, including how to package your reports and dashboards into apps. When you're finished with this course, you will have the skills and knowledge to use Power BI Dashboards - and take your solutions all the way from initial concept, through to delivery, and beyond.

    More details


    User Reviews
    Rating
    0
    0
    0
    0
    0
    average 0
    Total votes0
    Focused display
    Matthew Calderwood
    Matthew Calderwood
    Instructor's Courses

    Matt Calderwood is a Senior Software Engineer from the UK with over fifteen years' experience of building web applications with the Microsoft technology stack. Recently he has been creating solutions using the Microsoft Azure platform and Power BI - enabling organizations to gain new insights with their data and to push the boundaries of what is possible with business intelligence. His background in programming, along with his passion for all things AI, Data, and Machine Learning, gives him a unique perspective on modern application development.
    Pluralsight, LLC is an American privately held online education company that offers a variety of video training courses for software developers, IT administrators, and creative professionals through its website. Founded in 2004 by Aaron Skonnard, Keith Brown, Fritz Onion, and Bill Williams, the company has its headquarters in Farmington, Utah. As of July 2018, it uses more than 1,400 subject-matter experts as authors, and offers more than 7,000 courses in its catalog. Since first moving its courses online in 2007, the company has expanded, developing a full enterprise platform, and adding skills assessment modules.
    • language english
    • Training sessions 70
    • duration 4:04:17
    • level average
    • Release Date 2023/10/10