Complete Course on Data Visualization, Matplotlib and Python
Focused View
4:32:21
121 View
1. Python Data Visualization.mp4
00:25
2. Statistics arent enough..mp4
00:53
3. Why Visualize Data.mp4
01:00
4. Why Python.mp4
00:47
5. Python Visualization Eco System.mp4
00:36
6. Course Objectives.mp4
00:53
7. Topic outlines.mp4
01:21
8. Python Check.mp4
01:06
9. Source Code.mp4
00:22
1. Introduction to Visualization Concepts.mp4
00:47
2. Aesthetics.mp4
01:21
3. Data Types.mp4
00:51
4. Visualization Variables.mp4
01:13
5. Colors.mp4
01:33
6. Small Multiple Plots.mp4
01:02
7. Analysis types.mp4
01:14
8. Working with Data.mp4
01:08
1. Introduction to Matplotlib.mp4
00:29
2. Matplotlib History.mp4
00:59
3. Matplotlib landscape.mp4
00:46
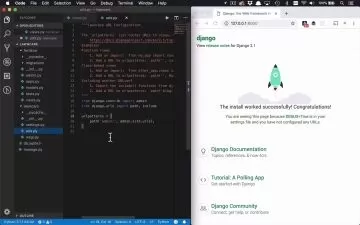
4. System Setup.mp4
02:37
5. Data Set.mp4
01:49
6. Figure Overview.mp4
01:07
7. Interface Types.mp4
01:41
8. Launching notebooks.mp4
01:12
9. Reading Data.mp4
02:03
10. Pyplot Example.mp4
02:12
11. Object Oriented API.mp4
04:46
12. Histograms.mp4
03:34
13. Figures And Axes.mp4
05:35
14. Saving Images.mp4
01:51
15. Quick References.mp4
01:14
16. Line Plots.mp4
04:19
17. Bar Charts.mp4
01:49
18. Scatter Plots.mp4
05:25
19. Styles.mp4
02:51
20. Regressions.mp4
03:15
21. Customizing Multiple Plots.mp4
03:34
22. References.mp4
01:40
23. Summary.mp4
01:40
1. Introduction to Pandas.mp4
00:21
2. Pandas Overview.mp4
00:52
3. API Overview.mp4
01:33
4. Basic API Example.mp4
05:41
5. API Summary.mp4
01:02
6. Specialized hist and Box Plot API.mp4
00:59
7. Advanced Specialized Plots.mp4
05:01
8. Advanced Plot Summary.mp4
01:03
9. Pandas Conclusion.mp4
01:14
1. Introduction To Seaborn.mp4
00:29
2. Seaborn Overview.mp4
01:41
3. Getting Started.mp4
00:58
4. Figures and Axes level PLot.mp4
01:57
5. Data Set Changes.mp4
01:53
6. Displot.mp4
04:16
7. Catplot.mp4
03:32
8. Relplot.mp4
01:46
9. Seaborn API Summary.mp4
01:23
10. Displot Replot and Facetting.mp4
04:40
11. Catplot API Summary.mp4
03:55
12. Specialized plots.mp4
01:08
13. Heatmap.mp4
04:32
14. Pair and jointplot.mp4
04:31
15. Customizing Seaborn Summary.mp4
01:25
16. Seaborn Summary.mp4
01:15
1. Introduction to Altair.mp4
00:42
2. Overview.mp4
01:01
3. Vega Lite.mp4
01:16
4. Installing.mp4
00:57
5. Shorthand API.mp4
01:26
6. Basic Shorthand API.mp4
03:47
7. Additional Examples of the Basic API.mp4
02:56
8. Longhand API.mp4
03:38
9. Longhand Overview.mp4
01:37
10. Data Type.mp4
01:26
11. Type Viz Alterations.mp4
01:24
12. Concat Charts.mp4
02:33
13. Faceting.mp4
01:22
14. layers.mp4
02:13
15. Multiple Chart Summary.mp4
00:58
16. Amazon Data Set.mp4
02:52
17. Amazon Authors.mp4
05:19
18. Reference Examples.mp4
01:09
19. Conclusion.mp4
01:18
1. Introduction To plotly.mp4
00:34
2. OverView.mp4
01:06
3. API Intro.mp4
01:08
4. Installing.mp4
00:53
5. Basic Plotting.mp4
03:03
6. Customizing Map.mp4
02:42
7. Additional Plot Types.mp4
03:42
8. API Overview.mp4
01:33
9. Scatter Plots.mp4
03:17
10. Line Bar Area.mp4
02:38
11. Regression treemap Heatmap.mp4
04:53
12. Facetting.mp4
03:22
13. Annotations.mp4
02:42
14. Annotation Summary.mp4
00:50
15. Conclusion.mp4
01:10
1. introduction to Streamlit.mp4
00:31
2. Background.mp4
00:57
3. Installation.mp4
00:56
4. Basic App Concept.mp4
00:58
5. Simple App Example.mp4
02:32
6. Streamlit Running overview.mp4
02:06
7. API Summary.mp4
01:32
8. Widget Summary.mp4
02:43
9. Widget Interactivity.mp4
01:13
10. User input.mp4
02:33
11. Show Charts.mp4
03:00
12. Sidebar Intros.mp4
02:43
13. Sidebar Detail.mp4
02:29
14. Conclusion.mp4
01:09
1. Introduction to Dash.mp4
00:34
2. Overview.mp4
00:46
3. Why Dash.mp4
00:54
4. Getting Started.mp4
00:34
5. Program Structure.mp4
01:02
6. First App.mp4
02:48
7. Running App.mp4
02:19
8. Component Overview.mp4
01:39
9. HTML.mp4
03:42
10. interactive App.mp4
03:40
11. interactive App Demo.mp4
01:47
12. Callback reference.mp4
00:41
13. Final App Overview.mp4
00:40
14. Full app Part.mp4
03:32
15. Full App data filtering.mp4
04:27
16. Full App Demo.mp4
02:12
17. Advance Topics.mp4
00:57
18. Conclusion.mp4
01:22
1. Course review.mp4
01:14
2. Objectives.mp4
01:13
3. Data Vis Concepts.mp4
01:03
4. Matplotlib.mp4
01:23
5. pandas.mp4
00:59
6. Seaborn.mp4
01:11
7. Altair.mp4
01:07
8. Plotly.mp4
00:47
9. Streamlit.mp4
00:49
10. Dash.mp4
00:57
11. My Workflow.mp4
01:06
More details
User Reviews
Rating
average 0
Focused display
Category

Udemy
View courses UdemyStudents take courses primarily to improve job-related skills.Some courses generate credit toward technical certification. Udemy has made a special effort to attract corporate trainers seeking to create coursework for employees of their company.
- language english
- Training sessions 142
- duration 4:32:21
- Release Date 2023/04/06