Companies Home Search Profile

Build Your First Data Visualization with NVD3

Focused View

Nertil Poci

54:12

7 View
  • 01. Course Overview.mp4
    02:29
  • 02. Overview.mp4
    02:34
  • 03. Installing and Configuring NVD3.mp4
    07:28
  • 04. Visualizing Data Using NVD3.mp4
    06:37
  • 05. Updating NVD3 Chart Data in Real Time.mp4
    07:51
  • 06. Summary.mp4
    01:00
  • 07. Overview.mp4
    01:41
  • 08. Enabling Focused View on NVD3 Charts.mp4
    02:34
  • 09. Visualizing Different Datasets within One Chart Using NVD3.mp4
    06:14
  • 10. Customizing the HTML Content of NVD3 Chart Components.mp4
    04:30
  • 11. Handling Events on NVD3 Charts.mp4
    04:12
  • 12. Customizing NVD3 Chart Styling.mp4
    04:13
  • 13. Summary.mp4
    02:49
  • Description


    This course will teach you how to use NVD3 to build reusable charts and chart components for d3.js without taking away the power that d3.js gives you as well as visualize different datasets on your web applications.

    What You'll Learn?


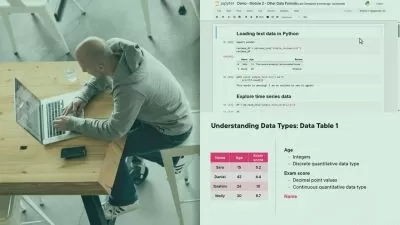
      Almost any application needs to visualize some data. When it comes to data visualization, you need to use a third party library since building data visualization components from scratch is time-consuming and unnecessary. In this course, Build Your First Data Visualization with NVD3, you’ll learn how to leverage the power of d3.js charts through the NVD3 library. First, you'll explore how to build reusable charts and chart components for your application. Next, you'll learn how to install and configure the NVD3 library, then display time series data retrieved from API into charts so that your users can understand how the application is performing. Next, you'll learn how to customize your data, NVD3 charts, and HTML content, and make them interactive. Finally, you’ll learn how to update graph data and customize data update settings for your charts to handle data that changes quickly. By the end of this course, you'll have the knowledge about NVD3 data visualization to design and customize your own NVD3 data charts.

    More details


    User Reviews
    Rating
    0
    0
    0
    0
    0
    average 0
    Total votes0
    Focused display
    Nertil is a freelance software architect working with different companies around the globe to help them bring their products to market. He has a master’s degree in computer science with a focus in software architecture. One of his main passions is discovering new tools and libraries that exists out there. Knowing what tools are available building apps much easier and gives you the confidence you need when challenging task comes along. Nertil enjoys building practical open source apps in his spare time, it’s how he stays up to date with the latest technologies and contributes back to the open source community.
    Pluralsight, LLC is an American privately held online education company that offers a variety of video training courses for software developers, IT administrators, and creative professionals through its website. Founded in 2004 by Aaron Skonnard, Keith Brown, Fritz Onion, and Bill Williams, the company has its headquarters in Farmington, Utah. As of July 2018, it uses more than 1,400 subject-matter experts as authors, and offers more than 7,000 courses in its catalog. Since first moving its courses online in 2007, the company has expanded, developing a full enterprise platform, and adding skills assessment modules.
    • language english
    • Training sessions 13
    • duration 54:12
    • level average
    • Release Date 2023/12/09

    Courses related to Data Visualization