Companies Home Search Profile

Build Your First Data Visualization with CanvasJS

Focused View

Martin Burger

1:04:23

32 View
  • 01 - Course Overview.mp4
    01:23
  • 02 - Introduction - Exploring CanvasJS for Data Visualization.mp4
    01:07
  • 03 - Environment Setup.mp4
    02:10
  • 04 - Project Preparations.mp4
    03:09
  • 05 - The HTML Code.mp4
    04:33
  • 06 - CanvasJS Fundamentals.mp4
    03:37
  • 07 - Introducing the Data.mp4
    04:07
  • 08 - Loading a Local JSON File.mp4
    03:56
  • 09 - Summary.mp4
    01:29
  • 10 - Introduction - Modifying a CanvasJS Plot.mp4
    01:32
  • 11 - Accessing and Parsing the Data.mp4
    04:44
  • 12 - Visualizing a Single Data Series.mp4
    05:27
  • 13 - Multi Series Data Visualization.mp4
    03:39
  • 14 - Coloring and Emphasizing Data Points.mp4
    03:19
  • 15 - Styling Text Elements.mp4
    05:38
  • 16 - Grid Lines, Interlaced Color, and Strip Lines.mp4
    03:59
  • 17 - Enabling and Styling the Chart Legend.mp4
    02:51
  • 18 - Editing and Styling the Tooltip.mp4
    05:04
  • 19 - Summary and Further Reading.mp4
    02:39
  • Description


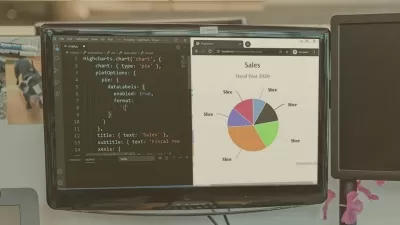
    Learn how to use the CanvasJS charting library to integrate data visualizations into websites and apps.

    What You'll Learn?


      There are plenty of ways to display data on your web application. In this course, Build Your First Data Visualization with CanvasJS, you’ll see how CanvasJS helps you in generating different types of charts. First, you’ll learn how to set up a working environment . Next, you’ll discover how to connect to a local server and other data sources. Then, once the setup is complete, you will discover how to create, modify and annotate different chart types. Finally, you will explore multivariate charts and combined charts. When you’re finished with this intro course, you’ll have the skills to create and modify a standard data visualization in CanvasJS.

    More details


    User Reviews
    Rating
    0
    0
    0
    0
    0
    average 0
    Total votes0
    Focused display
    Martin Burger
    Martin Burger
    Instructor's Courses
    Martin studied biostatistics and worked for several pharmaceutical companies before he became a data science consultant and author. He published over 15 courses on R, Tableau 9 and other data science related subjects. His main focus lies on analytics software like R and SPSS but he is also interested in modern data visualization tools like Tableau. If he is not busy coding, blogging or working out new teaching concepts you may find him skiing or hiking in the Alps.
    Pluralsight, LLC is an American privately held online education company that offers a variety of video training courses for software developers, IT administrators, and creative professionals through its website. Founded in 2004 by Aaron Skonnard, Keith Brown, Fritz Onion, and Bill Williams, the company has its headquarters in Farmington, Utah. As of July 2018, it uses more than 1,400 subject-matter experts as authors, and offers more than 7,000 courses in its catalog. Since first moving its courses online in 2007, the company has expanded, developing a full enterprise platform, and adding skills assessment modules.
    • language english
    • Training sessions 19
    • duration 1:04:23
    • level preliminary
    • Release Date 2023/12/05