Become Zero to Pro in Microsoft Power Bi in 15 Days (2023)
Unicliff Edutech
7:45:26
Description
Master Power BI Desktop for data analysis with hands-on assignments & projects from top-rated Institute
What You'll Learn?
- Learn Power BI from scratch
- Connect to data sources
- Learn to Create Reports
- Learn to Create Dashboards
- Create Visualizations
- Clean Data with PowerQuery
- DAX formulas
- Creating custom themes
- Working with APIs
- Power BI Administration and Deployment
- Using Power BI Premium
Who is this for?
What You Need to Know?
More details
DescriptionLearn how to effectively use Microsoft Power BI for data visualization and analysis, enabling you or decision-makers to uncover valuable insights such as customer buying patterns, sales trends, and production bottlenecks. The course will cover all the features of Power BI, allowing you to easily and beautifully explore, manipulate, prepare, and present data.
With Power BI, you can connect to various datasets, drill down and up in visualizations, perform calculations, and represent data through charts, plots, and maps. The aim is to transform raw data into compelling visualizations using the capabilities of Microsoft Power BI. The course includes practical exercises to reinforce your learning by immediate application.
The content of the course is regularly updated to keep up with new releases of Power BI, enabling you to continuously refine your skills and stay ahead of the competition.
The course begins with the basics of Power BI, ensuring even beginners feel comfortable navigating the software, connecting to data files, and exporting worksheets. To identify trends and make accurate forecasts, you will learn how to work with hierarchies and time series. Additionally, you'll discover techniques to summarize information using aggregations and ensure precise calculations through granularity.
To visualize data effectively, you'll learn how to create various charts, maps, scatterplots, and interactive dashboards for each project. You'll also gain knowledge on combining multiple data sources into one analytical solution, facilitating the integration of diverse information sources.
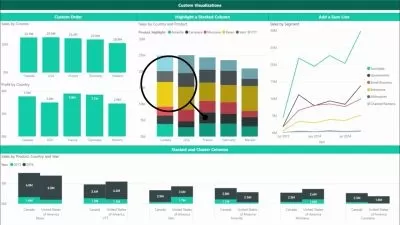
Finally, you'll explore the latest and advanced custom visualizations in Power BI, including histograms and brick charts, enhancing your data visualization capabilities.
By the end of the course, you'll be a highly proficient Power BI user, equipped with the skills of a data scientist to extract knowledge, analyze complex questions, and visualize data with ease. Whether you're working with scientific data or aiming to forecast buying trends for increased profits, you'll be fully prepared to collect, examine, and present data for any purpose.
Who this course is for:
- Anyone that has never used Power BI before and is looking for a hands-on approach to learn it
- Anyone working with data and get professional working with Power BI
- Anyone that wants to pursue a career as a data analyst, data scientist or BI consultant
Learn how to effectively use Microsoft Power BI for data visualization and analysis, enabling you or decision-makers to uncover valuable insights such as customer buying patterns, sales trends, and production bottlenecks. The course will cover all the features of Power BI, allowing you to easily and beautifully explore, manipulate, prepare, and present data.
With Power BI, you can connect to various datasets, drill down and up in visualizations, perform calculations, and represent data through charts, plots, and maps. The aim is to transform raw data into compelling visualizations using the capabilities of Microsoft Power BI. The course includes practical exercises to reinforce your learning by immediate application.
The content of the course is regularly updated to keep up with new releases of Power BI, enabling you to continuously refine your skills and stay ahead of the competition.
The course begins with the basics of Power BI, ensuring even beginners feel comfortable navigating the software, connecting to data files, and exporting worksheets. To identify trends and make accurate forecasts, you will learn how to work with hierarchies and time series. Additionally, you'll discover techniques to summarize information using aggregations and ensure precise calculations through granularity.
To visualize data effectively, you'll learn how to create various charts, maps, scatterplots, and interactive dashboards for each project. You'll also gain knowledge on combining multiple data sources into one analytical solution, facilitating the integration of diverse information sources.
Finally, you'll explore the latest and advanced custom visualizations in Power BI, including histograms and brick charts, enhancing your data visualization capabilities.
By the end of the course, you'll be a highly proficient Power BI user, equipped with the skills of a data scientist to extract knowledge, analyze complex questions, and visualize data with ease. Whether you're working with scientific data or aiming to forecast buying trends for increased profits, you'll be fully prepared to collect, examine, and present data for any purpose.
Who this course is for:
- Anyone that has never used Power BI before and is looking for a hands-on approach to learn it
- Anyone working with data and get professional working with Power BI
- Anyone that wants to pursue a career as a data analyst, data scientist or BI consultant
User Reviews
Rating
Unicliff Edutech
Instructor's Courses
Udemy
View courses Udemy- language english
- Training sessions 38
- duration 7:45:26
- Release Date 2023/08/19


