Visually Stunning Microsoft Excel Dynamic Dashboard Course
The Dronaachaarya
6:46:14
Description
Become an Excel Dashboard Expert : 11 Basic, 3 Intermediate and 4 Advanced Level Dynamic Dashboards without any VBA code
What You'll Learn?
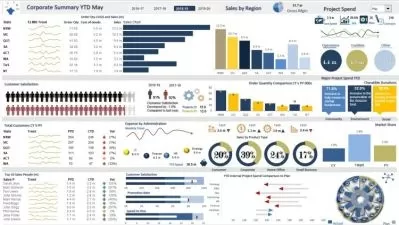
- The Art of creating Visually Stunning Excel Dashboards.
- You will start with 11 Basic Level Dashboards and gradually move to 3 Intermediate and 4 Advanced Level Charts.
- Practicing the charts along with the course will make you a Master of MS Excel Dashboards.
Who is this for?
What You Need to Know?
More details
DescriptionThis course teaches you to create well-designed dynamic Excel dashboards so you and your colleagues can see trends and make quick decisions informed by data.
By participating in this Microsoft Excel Dashboard course you'll gain the widely sought after skills necessary to effectively analyze large sets of data.Â
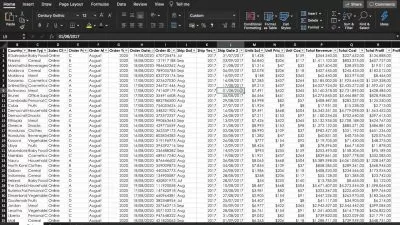
In this topic, we’ll discuss how to use multiple PivotTables, PivotCharts and PivotTable tools to create a dynamic excel dashboards. Then we'll give users the ability to quickly filter the data the way they want with Slicers and a Timeline, which allow your PivotTables and charts to automatically expand and contract to display only the information that users want to see. In addition, you can quickly refresh your dashboard when you add or update data. This makes it very handy because you only need to create the excel dashboard report once.
You will start with 11 Basic Level Excel Dashboards and gradually move to 3 Intermediate and 4 Advanced Level dashboard. Practicing the dashboard along with the course will make you a Master of Microsoft Excel Dashboards.
Who this course is for:
- This course is meant for students who wish to create beautiful Dynamic Dashboard using MS Excel for Data Visualization and Analysis.
- Anyone who would like to take his Excel Skills to the next level.
- Anyone who is into MIS, Data Analytics and Database Management System
This course teaches you to create well-designed dynamic Excel dashboards so you and your colleagues can see trends and make quick decisions informed by data.
By participating in this Microsoft Excel Dashboard course you'll gain the widely sought after skills necessary to effectively analyze large sets of data.Â
In this topic, we’ll discuss how to use multiple PivotTables, PivotCharts and PivotTable tools to create a dynamic excel dashboards. Then we'll give users the ability to quickly filter the data the way they want with Slicers and a Timeline, which allow your PivotTables and charts to automatically expand and contract to display only the information that users want to see. In addition, you can quickly refresh your dashboard when you add or update data. This makes it very handy because you only need to create the excel dashboard report once.
You will start with 11 Basic Level Excel Dashboards and gradually move to 3 Intermediate and 4 Advanced Level dashboard. Practicing the dashboard along with the course will make you a Master of Microsoft Excel Dashboards.
Who this course is for:
- This course is meant for students who wish to create beautiful Dynamic Dashboard using MS Excel for Data Visualization and Analysis.
- Anyone who would like to take his Excel Skills to the next level.
- Anyone who is into MIS, Data Analytics and Database Management System
User Reviews
Rating

The Dronaachaarya
Instructor's Courses
Udemy
View courses Udemy- language english
- Training sessions 30
- duration 6:46:14
- Release Date 2023/08/25