Companies Home Search Profile

Visualizing Data Using Stata

Focused View

Najib Mozahem

3:44:34

24 View
  • 01.Overview of the course.mp4
    01:33
  • 02.The dataset.mp4
    07:26
  • 03.Conclusion.mp4
    03:30
  • 04.Introduction.mp4
    01:29
  • 05.Histograms.mp4
    13:09
  • 06.Symmetry and Quantile plots.mp4
    16:30
  • 07.Box plots.mp4
    08:55
  • 08.Conclusion.mp4
    01:36
  • 09.Introduction.mp4
    01:45
  • 10.Histograms.mp4
    12:31
  • 11.Quantile-quantile plots.mp4
    09:10
  • 12.Box plots.mp4
    05:21
  • 13.Bar graphs.mp4
    04:17
  • 14.Dot plots.mp4
    02:08
  • 15.Conclusion.mp4
    01:13
  • 16.Introduction.mp4
    01:22
  • 17.Box plots.mp4
    07:35
  • 18.Bar graphs.mp4
    04:47
  • 19.Dot plots.mp4
    04:41
  • 20.Conclusion.mp4
    01:21
  • 21.Introduction.mp4
    01:07
  • 22.Titles, fonts, and legends.mp4
    14:53
  • 23.Schemes.mp4
    06:47
  • 24.Box plots.mp4
    11:48
  • 25.Bar graphs.mp4
    05:01
  • 26.Dot plots.mp4
    06:27
  • 27.Conclusion.mp4
    00:49
  • 28.Introduction.mp4
    01:10
  • 29.Quantile-quantile plots.mp4
    05:27
  • 30.Scatter plots.mp4
    08:34
  • 31.Median-splines.mp4
    08:54
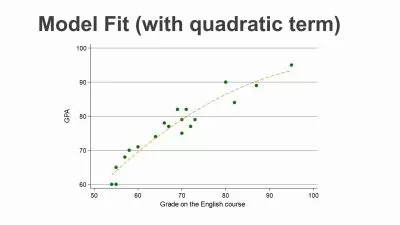
  • 32.Parametric fits - linear, quadratic, and polynomial.mp4
    10:01
  • 33.Conclusion.mp4
    01:13
  • 34.Introduction.mp4
    01:03
  • 35.Revisiting bar graphs, box plots, and dot plots.mp4
    11:04
  • 36.Using the if qualifier with the twoway command.mp4
    11:17
  • 37.Customizing the look with the twoway command.mp4
    06:58
  • 38.Conclusion.mp4
    01:42
  • Description


    This course introduces you to the graphical capabilities of Stata. It is designed to guide you through the logic of extracting meaning from datasets using visualization tools. This is accomplished by using a single dataset from the start of the course up until the very end.

    You will get up to speed with histograms, quantile plots, and symmetry plots, and even understand how to use these tools to investigate whether group differences exist. The course then introduces you to bar graphs, box plots, and dot plots, and demonstrates how these graphs can be used to study differences in groups that are divided along more than one dimension. You will later learn how to decide which type of plot is best suited for your needs. Finally, the course will get you hands-on with producing graphs that describe the relationship between two variables. All along, you will explore how to customize the colors and shapes used in the graphs.

    By the end of this course, you will have learned how to effectively visualize data using Stata.

    All the codes and supporting files for this course will be available at- https://github.com/PacktPublishing/Visualizing-Data-Using-Stata

    More details


    User Reviews
    Rating
    0
    0
    0
    0
    0
    average 0
    Total votes0
    Focused display
    Najib Mozahem
    Najib Mozahem
    Instructor's Courses
    Najib Mozahem works as a researcher and as an assistant professor at the university level, where he teaches Quantitative Analysis. He holds a Bachelor’s degree in Computer and Communication Engineering, completed his MBA with distinction, and completed his Ph.D. in Organizational Theory where he won the best thesis prize for Ph.D. He has also received the teaching excellence award for the year 2016 – 2017. His research interests include quantitative modeling and the study of human behavior in organizations.
    Packt is a publishing company founded in 2003 headquartered in Birmingham, UK, with offices in Mumbai, India. Packt primarily publishes print and electronic books and videos relating to information technology, including programming, web design, data analysis and hardware.
    • language english
    • Training sessions 38
    • duration 3:44:34
    • Release Date 2024/03/15

    Courses related to Data Visualization

    Courses related to Stata