Tableau for Finance: Visualize Financial Data using Tableau
Start-Tech Academy
9:13:50
Description
Learn to Analyze & Visualize Financial Data like a Pro with Tableau | Beginner-Friendly. Basic to Advanced level Tableau
What You'll Learn?
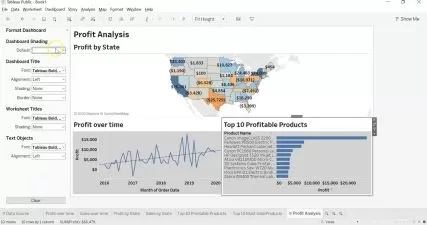
- Discover how to build interactive dashboards for financial analysis using Tableau.
- Learn to create compelling data-driven stories to effectively communicate insights to stakeholders using Tableau
- Recognize Tableau interface components, such as worksheets, shelves, and cards, and explain how to use various Tableau tools like filters, sorting & grouping
- Develop effective data visualizations that incorporate design principles such as layout, color & labeling, to effectively communicate insights to the audience
- Master advanced calculations and functions to analyze and visualize financial data in Tableau.
- Analyze and blend data from multiple sources using Tableau and its functionality, including data blending, joins, and unions to create meaningful insights
- Create an interactive dashboard that incorporates different types of visualizations to enable users to make data-driven decisionss
- Evaluate and use advanced analytics tools, such as forecasting, trend analysis, and statistical models, to gain insights from data and predict future trends
Who is this for?
More details
DescriptionIf you are a finance professional who wants to elevate your skills in data visualization and analysis, Tableau is the tool you need to master. Do you want to learn how to create stunning dashboards and visualizations that help you identify key insights and drive better financial decisions?
This course is designed to teach you everything you need to know about Tableau for finance, from the fundamentals to advanced techniques. You will learn how to develop interactive dashboards, master advanced calculations, and create data-driven stories that engage and inform stakeholders.
In this course, you will:
Develop your skills in data visualization, using Tableau's intuitive and powerful interface
Master advanced calculations and functions to make data-driven decisions
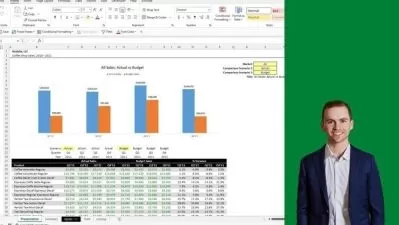
Create interactive dashboards and reports that engage and inform stakeholders
Learn how to create data-driven stories that communicate complex financial data
Gain the skills to work with large datasets and connect to various data sources
Data visualization and analysis are essential skills in the finance industry. This course will equip you with the skills and knowledge you need to make better financial decisions and communicate insights effectively.
Throughout the course, you will complete practical activities and exercises that reinforce your learning, including creating your own interactive dashboards and visualizations.
This course is taught by experienced finance professionals with expertise in data analysis and visualization. We bring a practical and industry-focused approach to our teaching, sharing real-world examples and scenarios to bring the material to life.
Enroll now and take your data analysis and visualization skills to the next level.
Who this course is for:
- Students who wish to join the field of Financial analytics
- Working Finance professionals looking to learn a powerful dashboarding and Data Visualization tool
- Anyone who wants to learn about Tableau from the very beginning
If you are a finance professional who wants to elevate your skills in data visualization and analysis, Tableau is the tool you need to master. Do you want to learn how to create stunning dashboards and visualizations that help you identify key insights and drive better financial decisions?
This course is designed to teach you everything you need to know about Tableau for finance, from the fundamentals to advanced techniques. You will learn how to develop interactive dashboards, master advanced calculations, and create data-driven stories that engage and inform stakeholders.
In this course, you will:
Develop your skills in data visualization, using Tableau's intuitive and powerful interface
Master advanced calculations and functions to make data-driven decisions
Create interactive dashboards and reports that engage and inform stakeholders
Learn how to create data-driven stories that communicate complex financial data
Gain the skills to work with large datasets and connect to various data sources
Data visualization and analysis are essential skills in the finance industry. This course will equip you with the skills and knowledge you need to make better financial decisions and communicate insights effectively.
Throughout the course, you will complete practical activities and exercises that reinforce your learning, including creating your own interactive dashboards and visualizations.
This course is taught by experienced finance professionals with expertise in data analysis and visualization. We bring a practical and industry-focused approach to our teaching, sharing real-world examples and scenarios to bring the material to life.
Enroll now and take your data analysis and visualization skills to the next level.
Who this course is for:
- Students who wish to join the field of Financial analytics
- Working Finance professionals looking to learn a powerful dashboarding and Data Visualization tool
- Anyone who wants to learn about Tableau from the very beginning
User Reviews
Rating

Start-Tech Academy
Instructor's Courses
Udemy
View courses Udemy- language english
- Training sessions 65
- duration 9:13:50
- Release Date 2023/04/19