Tableau For Beginner
Subhashis Panda
3:58:54
Description
Learn Tableau Desktop for data visualization step by step.
What You'll Learn?
- Tableau Developer
- Understand Aggregation, Granularity, and Level of Detail
- Parameter Use case
- Filter Use Case
Who is this for?
What You Need to Know?
More details
DescriptionIntroduction To Tableau
Tableau product and Price
How to install Tableau Desktop
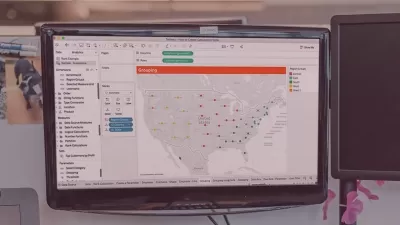
Use Interface Tableau Desktop
Rows vs. Column
Default AGG
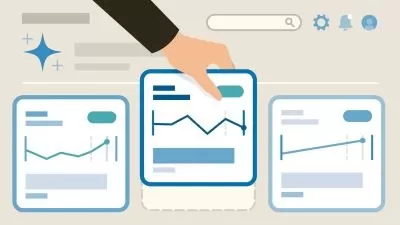
Type Of Charts like Scatter Plot,Bar Plot,histogram,Map,Line Chart, Area Chart
Customize charts like Donut Chart, lollypop Chart and Word Cloud
Aggregation and Granularity
Filter
Different Type of Filter
Order Of Operation Filter
SetÂ
Parameter
Function
Logical Function
String Function
Number Function
Date function
Analytics Tab Trendline,Constantline,Forecast,Regerence Lines
Tableau Lod and Use Case
Dashboard and story
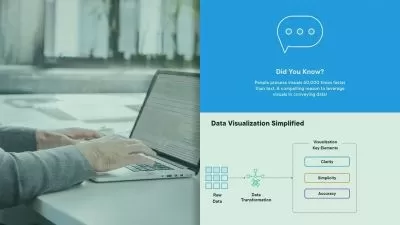
Learn data visualization through Tableau 2022 and create different types of charts and graphs for the requirement. How to develop the dashboard in Tableau, format the charts, use of filter and parameter. Develop the dashboard in tableau by diffrent data source like SQL, EXCEL and CSV Files
You'll learn all of the features in Tableau that allow you to explore, experiment with, fix, prepare, and present data easily, quickly, and beautifully.
Who this course is for:
1.Those who want to lean the Tableau Desktop from the Beginner level
2.This course is beneficial for Tableau Desktop users, including students, data analysts, business analysts, and data scientists.
3.Aspiring and junior data analysts
4.Junior business intelligence analysts
Who this course is for:
- Beginner for Bi Developer
Introduction To Tableau
Tableau product and Price
How to install Tableau Desktop
Use Interface Tableau Desktop
Rows vs. Column
Default AGG
Type Of Charts like Scatter Plot,Bar Plot,histogram,Map,Line Chart, Area Chart
Customize charts like Donut Chart, lollypop Chart and Word Cloud
Aggregation and Granularity
Filter
Different Type of Filter
Order Of Operation Filter
SetÂ
Parameter
Function
Logical Function
String Function
Number Function
Date function
Analytics Tab Trendline,Constantline,Forecast,Regerence Lines
Tableau Lod and Use Case
Dashboard and story
Learn data visualization through Tableau 2022 and create different types of charts and graphs for the requirement. How to develop the dashboard in Tableau, format the charts, use of filter and parameter. Develop the dashboard in tableau by diffrent data source like SQL, EXCEL and CSV Files
You'll learn all of the features in Tableau that allow you to explore, experiment with, fix, prepare, and present data easily, quickly, and beautifully.
Who this course is for:
1.Those who want to lean the Tableau Desktop from the Beginner level
2.This course is beneficial for Tableau Desktop users, including students, data analysts, business analysts, and data scientists.
3.Aspiring and junior data analysts
4.Junior business intelligence analysts
Who this course is for:
- Beginner for Bi Developer
User Reviews
Rating

Subhashis Panda
Instructor's Courses
Udemy
View courses Udemy- language english
- Training sessions 72
- duration 3:58:54
- Release Date 2023/10/14