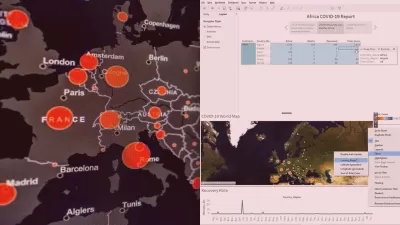
Tableau Desktop Hands-on Training for Absolute Beginners
Subhashish Ray
4:48:36
Description
Learn Tableau 2022 for data science step by step from scratch. A comprehensive course to get you started with Tableau.
What You'll Learn?
- Connect Tableau to various Datasets
- Create Bar Charts, Area Charts, Maps, Scatterplots, Pie Charts
- Create Storylines
- Create Dashboards
- Create Calculated Fields
- Create Table Calculations
- Create Dual Axis Charts
- Creating Data Extracts in Tableau
- Understand Data Hierarchies, Aggregation, Granularity and Level of Detail
- Adding Actions to Dashboards
- Adding Filters- Discrete, Continuous and Dates
- Assigning Geographical Roles to Data elements
- Change the data type and default properties for fields
- Creating Parameters
- Use Colors, Bold, Fonts and Shapes
- Dates- Date Parts vs Date values
- Creating groups
- Renaming a Data Field, Creating Aliases
Who is this for?
More details
DescriptionTableau Desktop is one of the most popular data visualization and BI platforms in the world, and a powerful tool for business analysts, data scientists, and business intelligence professionals alike.
This course is a practical, hands-on introduction to Tableau, created to teach you how to connect, visualize, analyze and present your insights in the form of visualization to your stakeholders.
We'll start with a quick introduction to the Tableau platform and interface, then connect and transform our first dataset. From there we'll explore sorting, filtering and grouping tools, build and format visuals, viz animations, create hierarchies and sets, create calculated fields, the building blocks of Tableau like role & type, dimensions and measures and finally tie it all together with dynamic, interactive dashboards and stories with optimizing device layouts.
Together we will go through the steps in creating various charts like bar, stacked bar, scatter plot, histogram, Line chart, trend line etc. We will create filters in our data for analysis and also enhance our view using various color and font options.
By the end of the course, you'll have a thorough and well-rounded understanding of Tableau Desktop, and can feel confident adding Tableau skills to your professional resume and also apply these tools to your own projects.
Who this course is for:
- Beginners- You should take this course if you want to learn Tableau completely from basic
- If you have some Tableau skills but want to get better
Tableau Desktop is one of the most popular data visualization and BI platforms in the world, and a powerful tool for business analysts, data scientists, and business intelligence professionals alike.
This course is a practical, hands-on introduction to Tableau, created to teach you how to connect, visualize, analyze and present your insights in the form of visualization to your stakeholders.
We'll start with a quick introduction to the Tableau platform and interface, then connect and transform our first dataset. From there we'll explore sorting, filtering and grouping tools, build and format visuals, viz animations, create hierarchies and sets, create calculated fields, the building blocks of Tableau like role & type, dimensions and measures and finally tie it all together with dynamic, interactive dashboards and stories with optimizing device layouts.
Together we will go through the steps in creating various charts like bar, stacked bar, scatter plot, histogram, Line chart, trend line etc. We will create filters in our data for analysis and also enhance our view using various color and font options.
By the end of the course, you'll have a thorough and well-rounded understanding of Tableau Desktop, and can feel confident adding Tableau skills to your professional resume and also apply these tools to your own projects.
Who this course is for:
- Beginners- You should take this course if you want to learn Tableau completely from basic
- If you have some Tableau skills but want to get better
User Reviews
Rating
Subhashish Ray
Instructor's Courses
Udemy
View courses Udemy- language english
- Training sessions 33
- duration 4:48:36
- Release Date 2023/03/16


