Companies Home Search Profile

Tableau Data Analytics & Visualization: Step by Step Guide

Focused View

Alexander Shafe

7:00:06

255 View
  • 01. Course Introduction.mp4
    02:43
  • 02. Introduction to Tableau.mp4
    02:11
  • 03. Understanding Tableau Platforms.mp4
    05:52
  • 04. Install Tableau Application.mp4
    04:11
  • 05. Install Microsoft Excel - Trial Version.mp4
    01:26
  • 06. Fields & Records.mp4
    01:16
  • 07. Tableau Start Page.mp4
    01:00
  • 08. How to Connect to Data.mp4
    03:12
  • 09. Data Types in Tableau.mp4
    03:41
  • 10. Tableau Connection.mp4
    04:16
  • 11. Review of Tableau Workspace.mp4
    02:56
  • 12. Know Your Data.mp4
    03:27
  • 13. Create Your First View.mp4
    08:30
  • 14. Understanding Dimension & Measures.mp4
    06:37
  • 15. Field Combinations.mp4
    02:52
  • 16. Marks Card.mp4
    04:29
  • 17. Filters.mp4
    05:49
  • 18. Sorting Data.mp4
    06:52
  • 19. Create Hierarchy.mp4
    04:12
  • 20. Working With Date Fields.mp4
    03:01
  • 21. Measure Names & Measure Values.mp4
    03:55
  • 22. Create Dual Axis Chart.mp4
    03:41
  • 23. Bar Chart.mp4
    03:03
  • 24. Line Chart.mp4
    01:51
  • 25. Area Chart.mp4
    04:22
  • 26. Text Table.mp4
    03:03
  • 27. Pie Chart.mp4
    04:31
  • 28. Highlight Table.mp4
    02:46
  • 29. Histogram.mp4
    03:57
  • 30. Tree Map.mp4
    01:38
  • 31. Symbol & Field Maps.mp4
    05:46
  • 32. Donut Chart.mp4
    07:46
  • 33. Format workbook.mp4
    02:59
  • 34. Format Worksheet.mp4
    04:09
  • 35. Resize Tables & Cells.mp4
    02:47
  • 36. Create Groups.mp4
    04:45
  • 37. Create Sets.mp4
    06:16
  • 38. Create Sets II.mp4
    07:13
  • 39. Create Parameters.mp4
    08:31
  • 40. Introduction to Calculated Fields.mp4
    04:48
  • 41. String Functions - Basic Calculation.mp4
    11:01
  • 42. Date Functions - Basic Calculation.mp4
    08:28
  • 43. Aggregate Function - Basic Calculation.mp4
    05:32
  • 44. Logical Function - Basic Calculation.mp4
    10:02
  • 45. Table Calculation.mp4
    09:25
  • 46. Level of Detail Expression.mp4
    03:04
  • 47. Fixed LOD Calculation.mp4
    10:36
  • 48. Include LOD Calculation.mp4
    06:13
  • 49. Exclude LOD Calculation.mp4
    02:20
  • 50. Create Relationships between Data.mp4
    10:29
  • 51. Joins - Inner, Left, Right, Full Joins.mp4
    14:37
  • 52. Combine Date With Unions.mp4
    06:26
  • 53. Blend Multiple Data Sources.mp4
    11:07
  • 54. Marketing Campaign Project - I.mp4
    27:12
  • 55. Dashboard Environment.mp4
    04:28
  • 56. Marketing Campaign Project - II.mp4
    15:14
  • 57. Marketing Campaign Project - III.mp4
    11:00
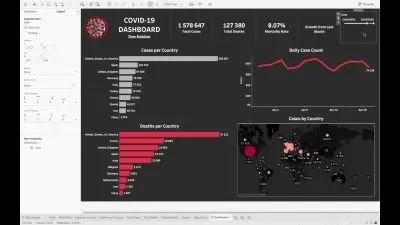
  • 58. Covid-19 Project - I.mp4
    14:56
  • 59. Covid-19 Project - II.mp4
    15:25
  • 60. Customer Incident Report Project - I.mp4
    34:03
  • 61. Customer Incident Report Project - II.mp4
    15:35
  • 62. Generate Data For Future Projects.mp4
    05:12
  • 63. Conclusion.mp4
    01:21
  • Description


    Tableau is one of the most popular and commonly used data visualization applications in business intelligence.

    This class is designed to take you from knowing absolutely nothing about Tableau to becoming proficient analyzing and creating compelling and interactive visualizations with Tableau.

    Who is this course for?

    If your goal is to become a Tableau Developer, Data Scientist, Data Analyst, Business Intelligence Developer, Business Analyst, Report Analyst, of work with data in any capacity, the importance of knowing Tableau cannot be over emphasized.

    This course is designed to equip you with what you need to be successful learning Tableau:

    • Step-by-step guide

    • Work with over 18 data sources

    • Lots of practice exercises to solidify your knowledge

    • Complete 3 guided projects

    Course Requirement or Prerequisites

    This course does not require any prior knowledge or specific academic background. The only requirement is having a laptop or desktop computer. All applications necessary for learning the course would be downloaded free from the internet.

    What You'll Learn?


      • Technology
      • Data Science
      • Interactive Charts
      • Business Intelligence
      • TABLEAU
      • Tableau In Data Science
      • Tableau BI Analytics

    More details


    User Reviews
    Rating
    0
    0
    0
    0
    0
    average 0
    Total votes0
    Focused display
    Alexander Shafe
    Alexander Shafe
    Instructor's Courses

    Hey there ! my name is Alex and I'm glad to be here with you. I have experience as a Data Consultant, Data Analyst and Database Administrator.

    My goal is to make your learning efficient, smooth and equip you with the skillset you need to start or transition into any data related field.

    My classes are hands-on and designed to cut through the chase teaching you what you need to know from beginner to advanced level.

    I am confident that by the end of the course you will feel confident in your skillset and ready to explore the many possibilities out there. Happy learning.


    Skillshare is an online learning community based in the United States for people who want to learn from educational videos. The courses, which are not accredited, are only available through paid subscription.
    • language english
    • Training sessions 63
    • duration 7:00:06
    • English subtitles has
    • Release Date 2023/02/15