Stata in 2 hours: Jumpstart in 2023
Maksym Obrizan
1:58:53
Description
Don't waste a single minute - get ready for your course work, term project or research in no time!
What You'll Learn?
- Learn to work in Stata in 2 hours over one evening or in a plane/airport
- Load various data formats in Stata (including native .dta, Excel, csv etc)
- Understand how Stata .do files work (commenting, shortening commands, basic commands)
- Get acquinted with your data using descriptive statistics (means, st. dev., range, percentiles)
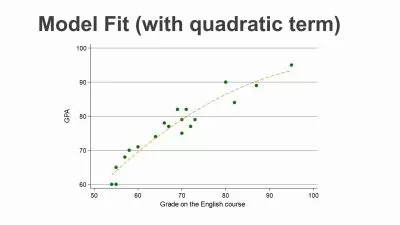
- Plot basic and advanced graphs (scatter plot, time series, histogram etc)
- Run and interpret linear regression (coefficients, significance, goodness-of-fit etc)
- Estimate models for an indicator variable (such as smoker/non-smoker) using linear probability model and probit
- Familiarize yourself with time series data (trends, seasonal effects, autoregressive models)
Who is this for?
More details
DescriptionJumpstart your Stata journey in 2023 with a fresh short course – great for those learners who want to start right away!
There are many great online courses in Stata that sell in thousands of copies. However, modern life is very fast and learners might not have 10 or more hours to get every single detail in Stata right away. My approach is different – I believe that you need only a few key instruments to start working in Stata.
Based on my 20+ years of experience in Stata I have picked those key tools for this course. In addition, I used my experience of teaching short courses (sometimes as short as just one evening!) for very diverse audiences including students, professionals, and adult learners to save your precious time and to allow quick learning based on examples.
After taking this course you will know how to open .dta, Excel, and .csv files in Stata and save your work in Stata .do files. You will be able to create new variables using conditional statements and recast a factor variable into a set of indicators (one for each factor). You will then create three key graphs – a histogram, scatter plot, and a time series line – with many essential extra features. We will also estimate 10+ regression models of continuous, indicator, and time series variables. Finally, we will learn how to create tables of publication quality which you can immediately insert into your MS Word file. By the end of the course, we will be able to use up to 20 essential Stata commands including those from Boston SSC Archive.
You will learn all these essential skills by running line-by-line 3 codes using 3 real (not fake!) datasets to model house prices in Ames (Iowa), the smoking behavior of Ukrainians based on the Household Budget Survey, and sales of vehicles in the United States over time. The codes contain very detailed comments and explanations which you can use to replicate the commands in your own projects.
Over my entire professional career, I have enjoyed working in Stata and hope that you will share my passion for this great and powerful tool that can help you to prepare engaging term projects, consultancy reports, or academic papers.
Let this course be the first step in this direction!
Who this course is for:
- Researchers who need to start working in Stata quickly
- Students who are late with their course project
- Professionals in health studies who need to use Stata for analyses
Jumpstart your Stata journey in 2023 with a fresh short course – great for those learners who want to start right away!
There are many great online courses in Stata that sell in thousands of copies. However, modern life is very fast and learners might not have 10 or more hours to get every single detail in Stata right away. My approach is different – I believe that you need only a few key instruments to start working in Stata.
Based on my 20+ years of experience in Stata I have picked those key tools for this course. In addition, I used my experience of teaching short courses (sometimes as short as just one evening!) for very diverse audiences including students, professionals, and adult learners to save your precious time and to allow quick learning based on examples.
After taking this course you will know how to open .dta, Excel, and .csv files in Stata and save your work in Stata .do files. You will be able to create new variables using conditional statements and recast a factor variable into a set of indicators (one for each factor). You will then create three key graphs – a histogram, scatter plot, and a time series line – with many essential extra features. We will also estimate 10+ regression models of continuous, indicator, and time series variables. Finally, we will learn how to create tables of publication quality which you can immediately insert into your MS Word file. By the end of the course, we will be able to use up to 20 essential Stata commands including those from Boston SSC Archive.
You will learn all these essential skills by running line-by-line 3 codes using 3 real (not fake!) datasets to model house prices in Ames (Iowa), the smoking behavior of Ukrainians based on the Household Budget Survey, and sales of vehicles in the United States over time. The codes contain very detailed comments and explanations which you can use to replicate the commands in your own projects.
Over my entire professional career, I have enjoyed working in Stata and hope that you will share my passion for this great and powerful tool that can help you to prepare engaging term projects, consultancy reports, or academic papers.
Let this course be the first step in this direction!
Who this course is for:
- Researchers who need to start working in Stata quickly
- Students who are late with their course project
- Professionals in health studies who need to use Stata for analyses
User Reviews
Rating

Maksym Obrizan
Instructor's Courses
Udemy
View courses Udemy- language english
- Training sessions 8
- duration 1:58:53
- Release Date 2023/03/16