Stata 100 Advanced Tips
Focused View
2:19:22
28 View
01-intro.mp4
01:46
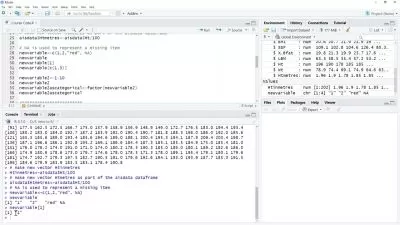
02-1. how to create a code book.mp4
01:00
03-2. how to create a label book.mp4
01:09
04-3. how to list only variable names.mp4
01:08
05-4. how to describe unopened data.mp4
01:04
06-5. how to search in variables.mp4
01:03
07-6. how to dropkeep variables sequentially.mp4
01:02
08-7. how to check a digital data signature.mp4
01:11
09-8. how to verify data.mp4
01:58
10-9. how to compare two datasets.mp4
01:17
11-10. how to compare variables.mp4
01:00
12-11. how to use tabulate to generate dummy variables.mp4
01:05
13-12. how to avoid many logical or operators.mp4
01:14
14-13. how to number labels.mp4
01:13
15-14. how to use labels in expressions.mp4
01:12
16-15. how to attach one value label to many variables.mp4
01:18
17-16. how to store single values.mp4
01:17
18-17. how to use statas hand-calculator.mp4
00:57
19-18. how to use text with statas hand-calculator.mp4
01:24
20-19. how to select column of data in a do-file.mp4
00:56
21-20. how to rectangularize data.mp4
01:27
22-21. how to check if variables uniquely identify observations.mp4
01:18
23-22. how to drop duplicate observations.mp4
01:07
24-23. how to draw a sample.mp4
01:23
25-24. how to transpose a dataset.mp4
00:54
26-25. how to quickly expand and interact many variables.mp4
01:24
27-26. how to create publication quality tables in word.mp4
01:10
28-27. how to create publication quality tables in excel.mp4
01:29
29-28. how to export regression results.mp4
01:13
30-29. how to create many one-way tables quickly.mp4
00:47
31-30. how to create many two-way tables quickly.mp4
01:25
32-31. how to sort and plot one-way tables.mp4
01:09
33-32. how to expand data instead of using weights.mp4
01:29
34-33. how to contract data to frequencies and percentages.mp4
01:14
35-34. how to compute immediate statistics without loading data.mp4
01:55
36-35. how to compute elasticities.mp4
01:19
37-36. how to set the default confidence level.mp4
01:21
38-37. how to show base levels of factor variables.mp4
01:31
39-38. how to estimate a constrained linear regression.mp4
01:34
40-39. how to bootstrap any regression.mp4
01:30
41-40. how to interpolate missing values.mp4
01:24
42-41. how to compute row statistics.mp4
01:21
43-42. how to compute standardized coefficients after linear regression.mp4
01:19
44-43. how to compute faster marginal effects.mp4
01:48
45-44. how to reduce collinearity in polynomial variables.mp4
01:12
46-45. how to use contrasting margins.mp4
01:32
47-46. how to use pairwise comparison with margins.mp4
01:47
48-47. how to define the constant in a regression.mp4
01:29
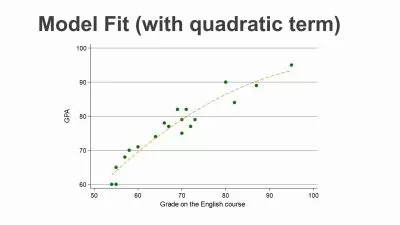
49-48. how to visualise complex polynomial models.mp4
01:13
50-49. how to identify outliers from a regression.mp4
01:35
51-50. how to hide unwanted output.mp4
01:07
52-51. how to force show wanted output.mp4
01:16
53-52. how to hide a graph.mp4
01:26
54-53. how to suppress error messages.mp4
01:25
55-54. how to force do-files to run to the end.mp4
00:56
56-55. how to execute programmes outside stata.mp4
01:21
57-56. how to check memory usage.mp4
01:04
58-57. how to reduce files sizes.mp4
00:51
59-58. how timestamp commands.mp4
00:48
60-59. how to set a stopwatch.mp4
01:08
61-60. how to pause stata.mp4
00:58
62-61. how to debug error messages.mp4
01:31
63-62. how to pause for large output.mp4
01:06
64-63. how to add custom ado folders.mp4
01:22
65-64. how to create a custom user profile.mp4
01:16
66-65. how to add comments to do-files.mp4
02:42
67-66. how to loop over non-integer values.mp4
00:54
68-67. how to monitor a loop.mp4
01:08
69-68. how to show more in the results window.mp4
00:46
70-69. how to display coefficient legends.mp4
01:06
71-70. how to squish a table.mp4
00:59
72-71. how to use and modify the function keys.mp4
01:41
73-72. how to view command sourcecode.mp4
01:11
74-73. how to create custom correlations.mp4
02:27
75-74. how to insert current time and date into log files.mp4
01:47
76-75. how to save interactive commands.mp4
01:37
77-76. how to recover data from a graph.mp4
01:29
78-77. how to generate a combined graph with one legend.mp4
01:38
79-78. how to display rgb colors in graphs.mp4
02:08
80-79. how to make colors opaque.mp4
01:36
81-80. why are svg graphs useful.mp4
01:18
82-81. how to apply log scaling to a graph.mp4
01:39
83-82. how to reverse and switch off axes.mp4
01:24
84-83. how to have multiple axes on a graph.mp4
01:41
85-84. how to display ascii characters in graphs.mp4
01:28
86-85. how to graph the variance-covariance matrix.mp4
01:45
87-86. how to quickly plot estimated results.mp4
01:36
88-87. how to randomly displace markers.mp4
01:56
89-88. how to range plot.mp4
01:50
90-89. how to download word frequencies from a webpage.mp4
01:45
91-90. how to create a violin plot.mp4
01:22
92-91. how to show the stata color palette.mp4
01:45
93-92. how to create custom titles.mp4
01:25
94-93. how to customize the look of graphs.mp4
02:02
95-94. how to show a correlation matrix as graphical table.mp4
01:21
96-95. how to plot a histogram with a boxplot.mp4
01:12
97-96. how to draw histograms with custom bins.mp4
01:47
98-97. how to graph a onetwothree-way table.mp4
01:54
99-98. how to recover graph code.mp4
01:12
100-99. how to do polar smoothing.mp4
01:44
101-100. the stata cheat sheet.mp4
00:59
More details
User Reviews
Rating
average 0
Focused display
Category

SkillShare
View courses SkillShareSkillshare is an online learning community based in the United States for people who want to learn from educational videos. The courses, which are not accredited, are only available through paid subscription.
- language english
- Training sessions 101
- duration 2:19:22
- Release Date 2024/03/09