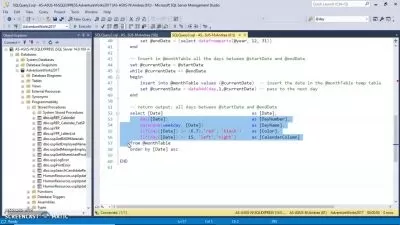
SQL Server: Reporting Services
Focused View
Adam Wilbert
3:42:53
0 View
01 - Present SQL data with Reporting Services.mp4
00:32
02 - What you should know.mp4
00:44
01 - What is SQL Server Reporting Services (SSRS).mp4
02:48
02 - Installing SSRS.mp4
02:34
03 - Install a SQL Server instance for the report server.mp4
02:30
04 - Configure the report server.mp4
07:07
05 - Set up the example database.mp4
02:07
06 - Access the web portal.mp4
05:03
07 - Install Report Builder.mp4
02:28
01 - Components of a report.mp4
02:31
02 - Create a report data source.mp4
07:41
03 - Create a dataset.mp4
06:13
04 - Add a data table with the wizard.mp4
05:42
05 - Joining data tables.mp4
05:56
06 - Format a report.mp4
06:50
07 - Reviewing report properties.mp4
05:33
08 - View, print, and export a report.mp4
02:24
01 - Create a shared data source.mp4
05:38
02 - Create a shared dataset.mp4
03:44
03 - Filtering data.mp4
06:24
04 - Grouping data in a report.mp4
03:52
05 - Understand matrixes.mp4
05:18
06 - Use aggregate functions.mp4
08:05
01 - Convert filters into parameters.mp4
05:38
02 - Report parameter properties.mp4
07:15
03 - Make a dynamic report title.mp4
01:52
04 - Add a parameter manually.mp4
04:47
05 - Report actions.mp4
05:21
06 - Sort records in a table.mp4
06:49
01 - Introduction to charts.mp4
02:57
02 - Create a chart.mp4
03:56
03 - Add additional data series.mp4
05:33
04 - Format charts.mp4
07:15
01 - Gauges.mp4
06:49
02 - Indicators.mp4
04:16
03 - Data bars.mp4
03:23
04 - Create a sparkline dataset.mp4
05:49
05 - Display a sparkline.mp4
03:12
06 - Maps.mp4
06:01
01 - Include header and footer details.mp4
07:12
02 - Add graphics and logos.mp4
02:26
03 - Align page elements.mp4
01:44
04 - Insert page breaks.mp4
05:01
01 - Add a key performance indicator (KPI).mp4
03:58
02 - Create a dynamic KPI.mp4
03:59
03 - Organize the web portal with folders.mp4
02:25
04 - Customize the web portal branding.mp4
04:13
05 - Create an SSRS user account.mp4
03:07
06 - Subscribe to a report.mp4
03:01
07 - Save report snapshots with historical data.mp4
01:47
01 - Next steps.mp4
01:23
Description
Get an introduction to Reporting Services, one of the core add-on components to SQL Server. With Reporting Services, you can create report frameworks that incorporate data tables, charts, maps, and other visualizations to help make sense of the data stored in a database. Instructor Adam Wilbert shows you how to configure all of the components and add them to traditional paginated reports, and how to organize those reports on a centralized web portal.
More details
User Reviews
Rating
average 0
Focused display
Category
Adam Wilbert
Instructor's Courses
Linkedin Learning
View courses Linkedin LearningLinkedIn Learning is an American online learning provider. It provides video courses taught by industry experts in software, creative, and business skills. It is a subsidiary of LinkedIn. All the courses on LinkedIn fall into four categories: Business, Creative, Technology and Certifications.
It was founded in 1995 by Lynda Weinman as Lynda.com before being acquired by LinkedIn in 2015. Microsoft acquired LinkedIn in December 2016.
- language english
- Training sessions 51
- duration 3:42:53
- English subtitles has
- Release Date 2025/01/15


