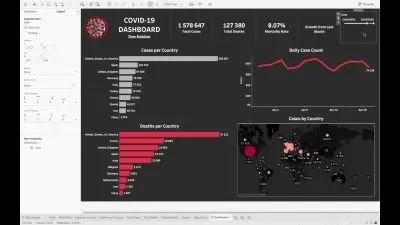
Splunk Dashboarding - Unlock the Power
L.A.M.E Creations
5:43:50
Description
Splunk Dashboards
What You'll Learn?
- Apply best practices when creating views / dashboards
- Create well-formed, global searches
- Customize charts and dashboards
- Use event handlers
- Create dynamic and contextual drilldowns
- Use Dashboard Studio
Who is this for?
What You Need to Know?
More details
DescriptionIn our comprehensive Splunk Dashboards and Visualization course on Udemy, you will master the art of creating powerful and insightful dashboards that can transform your data into actionable intelligence. This course is designed to equip you with the skills and best practices needed to design, implement, and manage effective dashboards using Splunk’s robust platform.
Key Training Objectives:
Apply Best Practices When Creating Views/Dashboards:
Learn the foundational principles and best practices for designing clean, efficient, and user-friendly dashboards. Understand how to structure your views to provide the most value to your end-users, ensuring your dashboards are intuitive and accessible.
Create Well-Formed, Global Searches:
Develop the ability to create efficient and reusable searches that can be applied across various dashboards. This includes crafting global searches that provide consistent data outputs, enhancing the reliability and performance of your visualizations.
Customize Charts and Dashboards:
Gain proficiency in tailoring charts and dashboards to meet specific business requirements. Customize visual elements to better represent your data, making use of Splunk’s diverse set of visualization tools to create impactful and meaningful representations of your data.
Use Event Handlers:
Learn how to implement event handlers to add interactivity to your dashboards. Understand how to trigger specific actions based on user inputs and events, creating a more dynamic and responsive user experience.
Create Dynamic and Contextual Drilldowns:
Master the techniques for creating drilldowns that provide deeper insights into your data. Enable users to explore data at various levels of granularity by setting up dynamic and contextual drilldowns that respond to user interactions.
Use Dashboard Studio:
Explore the capabilities of Splunk’s Dashboard Studio to create sophisticated and visually appealing dashboards. Learn how to leverage this powerful tool to design custom layouts, integrate various data sources, and enhance the overall look and functionality of your dashboards.
By the end of this course, you will have a thorough understanding of how to create, customize, and manage Splunk dashboards that are both powerful and user-friendly. Whether you are a beginner looking to get started with Splunk or an experienced user aiming to refine your skills, this course will provide you with the knowledge and practical experience needed to excel in the field of data visualization and dashboard creation.
Who this course is for:
- Splunk Analysts who are trying to improve their ability to create powerful and efficient dashboards.
In our comprehensive Splunk Dashboards and Visualization course on Udemy, you will master the art of creating powerful and insightful dashboards that can transform your data into actionable intelligence. This course is designed to equip you with the skills and best practices needed to design, implement, and manage effective dashboards using Splunk’s robust platform.
Key Training Objectives:
Apply Best Practices When Creating Views/Dashboards:
Learn the foundational principles and best practices for designing clean, efficient, and user-friendly dashboards. Understand how to structure your views to provide the most value to your end-users, ensuring your dashboards are intuitive and accessible.
Create Well-Formed, Global Searches:
Develop the ability to create efficient and reusable searches that can be applied across various dashboards. This includes crafting global searches that provide consistent data outputs, enhancing the reliability and performance of your visualizations.
Customize Charts and Dashboards:
Gain proficiency in tailoring charts and dashboards to meet specific business requirements. Customize visual elements to better represent your data, making use of Splunk’s diverse set of visualization tools to create impactful and meaningful representations of your data.
Use Event Handlers:
Learn how to implement event handlers to add interactivity to your dashboards. Understand how to trigger specific actions based on user inputs and events, creating a more dynamic and responsive user experience.
Create Dynamic and Contextual Drilldowns:
Master the techniques for creating drilldowns that provide deeper insights into your data. Enable users to explore data at various levels of granularity by setting up dynamic and contextual drilldowns that respond to user interactions.
Use Dashboard Studio:
Explore the capabilities of Splunk’s Dashboard Studio to create sophisticated and visually appealing dashboards. Learn how to leverage this powerful tool to design custom layouts, integrate various data sources, and enhance the overall look and functionality of your dashboards.
By the end of this course, you will have a thorough understanding of how to create, customize, and manage Splunk dashboards that are both powerful and user-friendly. Whether you are a beginner looking to get started with Splunk or an experienced user aiming to refine your skills, this course will provide you with the knowledge and practical experience needed to excel in the field of data visualization and dashboard creation.
Who this course is for:
- Splunk Analysts who are trying to improve their ability to create powerful and efficient dashboards.
User Reviews
Rating
L.A.M.E Creations
Instructor's Courses
Udemy
View courses Udemy- language english
- Training sessions 52
- duration 5:43:50
- Release Date 2024/10/31