Practical Financial Investment Analysis in R and tidyquant
Minerva Singh
3:02:57
Description
Conduct Financial Analysis and Portfolio Assessment With RStudio and tidyquant. Obtain & Work With Real Financial Data
What You'll Learn?
- LEARN To Obtain Real World Financial Data FREE From Yahoo and Quandl
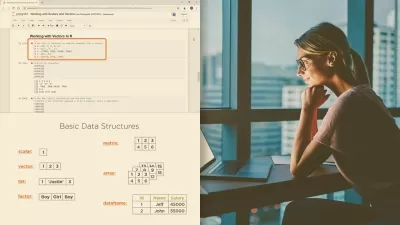
- BE ABLE To Read In, Pre-process & Visualize Financial Data
- LEARN How To Use Different R-based Packages For Financial Analysis (including tidyquant)
- USE Common Financial Analytics Technique For Financial Analysis
Who is this for?
What You Need to Know?
More details
DescriptionTHIS IS YOUR COMPLETE GUIDE TO FINANCIAL DATA ANALYSIS IN R!
This course is your complete guide to analyzing real-world financial data using R All the main aspects of analyzing financial data- statistics, data visualization, time series analysis and machine learning will be covered in depth.
If you take this course, you can do away with taking other courses or buying books on R-based data analysis. Â
In this age of big data, companies across the globe use R to sift through the avalanche of information at their disposal. By proficiently analysing financial data in R, you can give your company a competitive edge and boost your career to the next level.
                           Â
LEARN FROM AN EXPERT DATA SCIENTISTÂ WITH +5 YEARS OF EXPERIENCE:
Hey, my name is Minerva Singh, and I am an Oxford University MPhil (Geography and Environment), graduate. I recently finished a PhD at Cambridge University.
I have +5 years of experience in analyzing real-life data from different sources using data science-related techniques and I have produced many publications for international peer-reviewed journals.
 Throughout my research, I realised almost all the R data science courses and books out there do not account for the multidimensional nature of the topic.
So, unlike other instructors, I dig deep into the data science features of R and give you a one-of-a-kind grounding in data science-related topics!
With this course, in around 3 hours, you’ll get familiar with some of the most common R packages for obtaining, cleaning, visualizing and analyzing financial data for making data-driven decisions (either for yourself or your company)
Among other things:
· Obtain long-term stock market data from platforms such as Yahoo and Quandl
· Learn to visualize temporal financial data and produce clear graphs and visualizations
· Implement standard analysis techniques, including moving averages and the Sharpe ratio.
You’ll start by absorbing the most valuable R Data Science basics and techniques. I use easy-to-understand, hands-on methods to simplify and address even the most difficult concepts in the R Programming Language.
My course will help you implement REAL DATA methods obtained from different sources. Many courses use made-up data that does not empower students to implement R-based data science in real-life.
After taking this course, you’ll easily use the common time series and financial analysis packages in RStudio
You’ll understand the underlying concepts to understand what algorithms and methods best suit your data.
We will work with real data and you will have access to all the code and data used in the course.Â
JOIN MY COURSE NOW!
Who this course is for:
- Anyone Who Wants To Become Proficient In Financial Data Analysis Working With Real Life Data
- Anyone Who Wants Master Financial Data Analysis In RStudio
- Anyone Who Wants To Become An Expert Financial Data Scientist
THIS IS YOUR COMPLETE GUIDE TO FINANCIAL DATA ANALYSIS IN R!
This course is your complete guide to analyzing real-world financial data using R All the main aspects of analyzing financial data- statistics, data visualization, time series analysis and machine learning will be covered in depth.
If you take this course, you can do away with taking other courses or buying books on R-based data analysis. Â
In this age of big data, companies across the globe use R to sift through the avalanche of information at their disposal. By proficiently analysing financial data in R, you can give your company a competitive edge and boost your career to the next level.
                           Â
LEARN FROM AN EXPERT DATA SCIENTISTÂ WITH +5 YEARS OF EXPERIENCE:
Hey, my name is Minerva Singh, and I am an Oxford University MPhil (Geography and Environment), graduate. I recently finished a PhD at Cambridge University.
I have +5 years of experience in analyzing real-life data from different sources using data science-related techniques and I have produced many publications for international peer-reviewed journals.
 Throughout my research, I realised almost all the R data science courses and books out there do not account for the multidimensional nature of the topic.
So, unlike other instructors, I dig deep into the data science features of R and give you a one-of-a-kind grounding in data science-related topics!
With this course, in around 3 hours, you’ll get familiar with some of the most common R packages for obtaining, cleaning, visualizing and analyzing financial data for making data-driven decisions (either for yourself or your company)
Among other things:
· Obtain long-term stock market data from platforms such as Yahoo and Quandl
· Learn to visualize temporal financial data and produce clear graphs and visualizations
· Implement standard analysis techniques, including moving averages and the Sharpe ratio.
You’ll start by absorbing the most valuable R Data Science basics and techniques. I use easy-to-understand, hands-on methods to simplify and address even the most difficult concepts in the R Programming Language.
My course will help you implement REAL DATA methods obtained from different sources. Many courses use made-up data that does not empower students to implement R-based data science in real-life.
After taking this course, you’ll easily use the common time series and financial analysis packages in RStudio
You’ll understand the underlying concepts to understand what algorithms and methods best suit your data.
We will work with real data and you will have access to all the code and data used in the course.Â
JOIN MY COURSE NOW!
Who this course is for:
- Anyone Who Wants To Become Proficient In Financial Data Analysis Working With Real Life Data
- Anyone Who Wants Master Financial Data Analysis In RStudio
- Anyone Who Wants To Become An Expert Financial Data Scientist
User Reviews
Rating

Minerva Singh
Instructor's Courses
Udemy
View courses Udemy- language english
- Training sessions 30
- duration 3:02:57
- Release Date 2023/07/22
![ChatGPT Fundamental Course [UPDATED]](https://traininghub.ir/image/course_pic/8794-x225.webp)