Practical Data Analysis - SQL & Tableau with Real Projects
Graeme Gordon
8:13:03
Description
Hands-On Learning of SQL & Tableau and how they're used by a Data Analyst with Real Examples & Exercises
What You'll Learn?
- SQL Server - Beginner to Intermediate. You will install and use SQL Server Management Studio
- Write complex queries to extract data from a database - No prior experience required
- Understand Relational Databases and Entity Relationship Diagrams
- Do a Customer Profile on Adventureworks database including Google Sheets Pivot Tables and dual axies charts
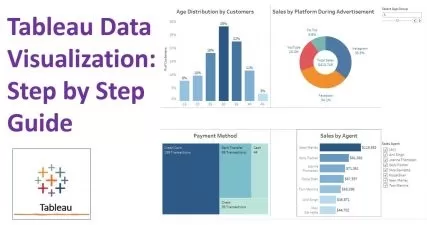
- Build Two Tableau Dashboards
- Create Calculated Fields and a Period Parameter in Tableau
- Publish your Tableau Dashboards Online so they can be accessed anywhere
Who is this for?
What You Need to Know?
More details
DescriptionThanks for your interest in this hands-on course for SQL and Tableau! In this comprehensive course, you will learn how to effectively analyze and visualize data using two of the most popular tools in the field of data science - SQL and Tableau.
Whether you're a beginner looking to dive into the world of data analysis or an experienced professional looking to enhance your skills, this course is designed to cater to all levels of learners. With a practical, hands-on approach, you'll gain the confidence to apply SQL and Tableau to real-world data scenarios.
In the SQL section, you'll start with the fundamentals, learning how to write basic queries using SQLÂ Server Management Studio.
Please note: Mac Users will need to install Azure Data Studio and Docker to be able to access SQLÂ Server. If you want to learn SQL on Mac, please see my other course which uses MySQL Workbench.
You'll gain expertise in querying databases, filtering and sorting data, and performing advanced operations such as joins, subqueries, window functions and aggregations.
You will then ask questions of the data and visualize the output in Google Sheets using pivot tables and charts to help identify trends.
In the Tableau section, you'll learn how to create interactive dashboards. You'll start with the basics, including connecting to data sources and creating visualizations using the drag and drop feature. You'll then move on to advanced topics such as calculated fields, sets and parameters. You'll also learn how to create dynamic and interactive visualizations that can be shared with others.
Throughout the course, you'll work on practical exercises to reinforce your learning. You'll gain real experience in data analysis and visualization, and build a portfolio of work to showcase your skills to potential employers.
By the end of this course, you'll have a strong foundation in SQL and Tableau, and be able to confidently analyze and visualize data for business intelligence, reporting, and decision-making purposes. Join us on this exciting journey to become a data analysis and visualization expert!
Course Features:
Comprehensive coverage of SQL and Tableau, from fundamentals to more advanced topics
Practical, hands-on approach with real-world projects and exercises
Step-by-step guidance and demonstrations
Portfolio-building opportunities
Access to course materials and updates for lifetime
Q&A support from the instructor
Certificate of completion
Don't miss this opportunity to become proficient in SQL and Tableau and unlock the power of data analysis and visualization. Enroll now and take your data skills to the next level!
Who this course is for:
- Beginners who want to learn data analysis and visualization from scratch
- Anyone interested in leveraging data for decision-making and insights
- Students pursuing careers in data analysis, business intelligence, or data visualization
Thanks for your interest in this hands-on course for SQL and Tableau! In this comprehensive course, you will learn how to effectively analyze and visualize data using two of the most popular tools in the field of data science - SQL and Tableau.
Whether you're a beginner looking to dive into the world of data analysis or an experienced professional looking to enhance your skills, this course is designed to cater to all levels of learners. With a practical, hands-on approach, you'll gain the confidence to apply SQL and Tableau to real-world data scenarios.
In the SQL section, you'll start with the fundamentals, learning how to write basic queries using SQLÂ Server Management Studio.
Please note: Mac Users will need to install Azure Data Studio and Docker to be able to access SQLÂ Server. If you want to learn SQL on Mac, please see my other course which uses MySQL Workbench.
You'll gain expertise in querying databases, filtering and sorting data, and performing advanced operations such as joins, subqueries, window functions and aggregations.
You will then ask questions of the data and visualize the output in Google Sheets using pivot tables and charts to help identify trends.
In the Tableau section, you'll learn how to create interactive dashboards. You'll start with the basics, including connecting to data sources and creating visualizations using the drag and drop feature. You'll then move on to advanced topics such as calculated fields, sets and parameters. You'll also learn how to create dynamic and interactive visualizations that can be shared with others.
Throughout the course, you'll work on practical exercises to reinforce your learning. You'll gain real experience in data analysis and visualization, and build a portfolio of work to showcase your skills to potential employers.
By the end of this course, you'll have a strong foundation in SQL and Tableau, and be able to confidently analyze and visualize data for business intelligence, reporting, and decision-making purposes. Join us on this exciting journey to become a data analysis and visualization expert!
Course Features:
Comprehensive coverage of SQL and Tableau, from fundamentals to more advanced topics
Practical, hands-on approach with real-world projects and exercises
Step-by-step guidance and demonstrations
Portfolio-building opportunities
Access to course materials and updates for lifetime
Q&A support from the instructor
Certificate of completion
Don't miss this opportunity to become proficient in SQL and Tableau and unlock the power of data analysis and visualization. Enroll now and take your data skills to the next level!
Who this course is for:
- Beginners who want to learn data analysis and visualization from scratch
- Anyone interested in leveraging data for decision-making and insights
- Students pursuing careers in data analysis, business intelligence, or data visualization
User Reviews
Rating
Graeme Gordon
Instructor's Courses
Udemy
View courses Udemy- language english
- Training sessions 84
- duration 8:13:03
- English subtitles has
- Release Date 2023/07/31


