Companies Home Search Profile

Power Query, Power Pivot, Data Viz & Power BI - 4in1 POWER
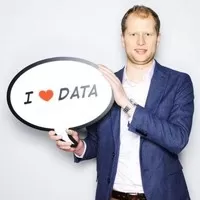
Focused View

Bartosz Czapiewski

13:08:51

141 View
  • 1. Power Query for Excel & Power BI -1.1. Append workbooks.mp4
    10:24
  • 2. 1.2. DYI Append two sheets of the same workbook.mp4
    08:33
  • 3. 1.3. Get data from folder of Excel files.mp4
    03:48
  • 4. 1.4. DYI Get data from folder of CSV files.mp4
    11:01
  • 5. 1.5. Get data from sheets with different names.mp4
    02:53
  • 6. 1.6. Appending problems.mp4
    12:50
  • 7. 2.1. Merge Excel sheets.mp4
    05:08
  • 8. 2.2. Merge scenarios.mp4
    11:45
  • 9. 2.3. DYI Merge.mp4
    07:36
  • 10. 3.1. Create a pivot table on a query.mp4
    12:09
  • 11. 3.2. New columns for pivot tables.mp4
    11:47
  • 12. 3.3. DYI Operating on columns.mp4
    02:51
  • 13. 3.4. Column from examples.mp4
    06:29
  • 14. 4.1. Group by = Pivot table.mp4
    09:50
  • 15. 5.1. Unpivot.mp4
    07:05
  • 16. 5.2. Unpivot dates.mp4
    01:37
  • 17. 5.3. Pivot column.mp4
    02:07
  • 18. 6.1. Get data from Web.mp4
    02:02
  • 19. 6.2. Get data from Web 2.mp4
    02:40
  • 20. 6.3. Get data from SQL.mp4
    03:34
  • 21.1 Power Query course.zip
  • 21. 7. Repetition.mp4
    09:41
  • 1.1 Data model & DAX language course.zip
  • 1. 1.1. Where to find data model in Power Pivot and Power BI.mp4
    03:16
  • 2. 1.2. How not to build a data model in Excel.mp4
    04:30
  • 3. 1.3. Creating queries in Power Query.mp4
    03:43
  • 4. 1.4. Creating relations in Power Pivot.mp4
    09:32
  • 5. 2.1. Designing a pivot table.mp4
    05:41
  • 6. 2.2. Product with no sales and basics of data model.mp4
    06:28
  • 7. 2.3. Distinct count.mp4
    03:09
  • 8. 2.4. Drill down.mp4
    01:33
  • 9. 3.1. Creating a hierarchy.mp4
    01:47
  • 10. 3.2. Hierarchy in a Pivot table.mp4
    04:06
  • 11. 3.3. Hierarchy on a slicer.mp4
    02:05
  • 12. 4.1. Creating a date table.mp4
    05:38
  • 13. 4.2. Hiding fields in Power Pivot.mp4
    02:13
  • 14. 4.3. Sorting by column.mp4
    03:27
  • 15. 5.1. My first measure SUM.mp4
    05:25
  • 16. 5.2. DIY SUM.mp4
    02:21
  • 17. 5.3. DIVIDE.mp4
    01:31
  • 18. 5.4. COUNT.mp4
    00:44
  • 19. 5.5. DIY COUNT.mp4
    02:25
  • 20. 5.6. COUNT vs COUNTROWS.mp4
    01:15
  • 21. 5.7. DIY basic formulas.mp4
    03:57
  • 22. 6.1. SUMIF vs SUM in a pivot table.mp4
    02:22
  • 23. 6.2. CALCULATE 6.mp4
    02:30
  • 24. 6.3. Pivot table not working filter context.mp4
    05:56
  • 25. 6.4. Basic measures with columns.mp4
    03:44
  • 26. 6.5. Limitations 6.mp4
    02:05
  • 27. 6.6. DIY CALCULATE.mp4
    02:22
  • 28. 7.1. SUMPRODUCT in Excel.mp4
    02:28
  • 29. 7.2. SUMX.mp4
    03:31
  • 30. 7.3. AVERAGEX.mp4
    01:17
  • 31. 7.4. DIY formulas with X.mp4
    04:00
  • 32. 7.5. Context transition.mp4
    03:24
  • 33. 8.1. SEARCH, FIND, IF, BLANK, SWITCH.mp4
    04:30
  • 34. 8.2. VALUES.mp4
    02:32
  • 35. 8.3. HASONEVALUE.mp4
    02:58
  • 36. 8.4. Other formulas DIY.mp4
    01:56
  • 37. 9.1. ALL on a table.mp4
    05:43
  • 38. 9.2. ALL on column and ALLEXCEPT.mp4
    04:25
  • 39. 9.3. ALLSELECTED.mp4
    01:40
  • 40. 9.4. DYI ALL functions.mp4
    02:30
  • 41. 10.1. How does the FILTER work.mp4
    03:38
  • 42. 10.2. FILTER with CALCULATE.mp4
    03:43
  • 43. 10.3. Row and filter context.mp4
    03:16
  • 44. 10.4. CALCULATE and CALCULATE with FILTER.mp4
    02:51
  • 45. 10.5. DIY FILTER.mp4
    02:00
  • 46. 11.1. SAMEPERIODLASTYEAR.mp4
    07:07
  • 47. 11.2. Year-To-Date.mp4
    03:32
  • 48. 11.3. Last Month.mp4
    02:25
  • 49. 11.4. Time formulas without Time Intelligence.mp4
    07:49
  • 1.1 Data Visualization & Dashboard Design course.zip
  • 1. Data Visualization & Dashboard-1.1. Simplicity is the ultimate sophistication.mp4
    04:25
  • 2. Data Visualization & Dashboard-1.2. Perception process.mp4
    03:25
  • 3. Data Visualization & Dashboard-1.3. Iconic memory and pre-attentive attributes.mp4
    08:29
  • 4. Data Visualization & Dashboard-1.4. Short-term memory and the limit of 4.mp4
    04:29
  • 5. Data Visualization & Dashboard-1.5. Brief history of data visualization.mp4
    05:53
  • 6. Data Visualization & Dashboard-1.6. The most famous chart ever created.mp4
    05:26
  • 7. Data Visualization & Dashboard-1.7. 5 elements of the well-designed chart.mp4
    02:12
  • 8. Data Visualization & Dashboard-1.8. Data-ink ratio.mp4
    07:23
  • 9. Data Visualization & Dashboard-1.9. Data-ink ratio exercise.mp4
    07:35
  • 10. Data Visualization & Dashboard-1.10. DIY Test.mp4
    01:00
  • 11. Data Visualization & Dashboard-1.11. Test results.mp4
    02:21
  • 12. Data Visualization & Dashboard-1.12. 7 data visualization rules.mp4
    10:55
  • 13. Data Visualization & Dashboard-12.1. DIY Redesign the charts.mp4
    01:07
  • 14. Data Visualization & Dashboard-12.2. Exercise 1.mp4
    05:29
  • 15. Data Visualization & Dashboard-12.3. Exercise 2.mp4
    02:58
  • 16. Data Visualization & Dashboard-12.4. Exercise 3.mp4
    05:25
  • 17. Data Visualization & Dashboard-12.5. Exercise 4.mp4
    02:24
  • 18. Data Visualization & Dashboard-12.6. Exercise 5.mp4
    02:25
  • 19. Data Visualization & Dashboard-12.7. Exercise 6.mp4
    01:21
  • 20. Data Visualization & Dashboard-12.8. Exercise 7.mp4
    04:57
  • 21. Data Visualization & Dashboard-12.9. DIY Summary.mp4
    02:36
  • 22. Data Visualization & Dashboard-3.1. Column chart exercise.mp4
    03:07
  • 23. Data Visualization & Dashboard-3.2. Line chart exercise.mp4
    06:53
  • 24. Data Visualization & Dashboard-3.3. Scatter chart exercise.mp4
    06:05
  • 25. Data Visualization & Dashboard-3.4. DIY Additional elements exercise.mp4
    05:47
  • 26. Data Visualization & Dashboard-3.5. Financial chart exercise.mp4
    12:38
  • 27. Data Visualization & Dashboard-3.6. DIY Guess the relationship.mp4
    02:15
  • 28. Data Visualization & Dashboard-3.7. Graph Selection Matrix.mp4
    02:26
  • 29. Data Visualization & Dashboard-3.8. Good practices summary.mp4
    11:35
  • 30. Data Visualization & Dashboard-4.1. Rules of using colors.mp4
    09:17
  • 31. Data Visualization & Dashboard-4.2. DIY Color on a chart exercise.mp4
    03:28
  • 32. Data Visualization & Dashboard-4.3. DIY Color in a table exercise.mp4
    02:10
  • 33. Data Visualization & Dashboard-4.4. DIY Heat map on a pivot table exercise.mp4
    04:50
  • 34. Data Visualization & Dashboard-5.1. Cascade chart.mp4
    08:05
  • 35. Data Visualization & Dashboard-5.2. Pareto chart.mp4
    01:48
  • 36. Data Visualization & Dashboard-5.3. Histogram.mp4
    03:49
  • 37. Data Visualization & Dashboard-5.4. Box and whisker chart.mp4
    06:14
  • 38. Data Visualization & Dashboard-5.5. Funnel chart.mp4
    01:46
  • 39. Data Visualization & Dashboard-5.6. Panel chart (aka small multiples).mp4
    09:35
  • 40. Data Visualization & Dashboard-5.7. DIY Panel chart.mp4
    02:57
  • 41. Data Visualization & Dashboard-5.8. Maps.mp4
    03:17
  • 42. Data Visualization6.1. DIY Find 2 differences & What would you tell the driver.mp4
    05:20
  • 43. Data Visualization & Dashboard-6.2. What is a dashboard.mp4
    03:28
  • 44. Data Visualization & Dashboard-6.3. Dashboard example.mp4
    01:00
  • 45. Data Visualization & Dashboard-6.4. Bullet graph.mp4
    03:20
  • 46. Data Visualization & Dashboard-6.5. Bullet graph exercise.mp4
    06:50
  • 47. Data Visualization & Dashboard-6.6. Sparklines.mp4
    02:34
  • 48. Data Visualization & Dashboard-6.7. Sparklines exercise.mp4
    06:51
  • 49. Data Visualization & Dashboard-6.8. Traffic lights & icons.mp4
    04:29
  • 50. Data Visualization & Dashboard-6.9. DIY Traffic lights & icons exercise.mp4
    04:28
  • 51. Data Visualization & Dashboard-6.10. Organize and add simple interactions.mp4
    02:56
  • 52. Data Visualization & Dashboard-6.11. Overview of well-designed dashboards.mp4
    02:07
  • 53. Data Visualization & Dashboard-7.1. Analytical dashboard vs Management dashboard.mp4
    02:46
  • 54. Data visualization and dashboard -7.2. KPIs exercise.mp4
    04:45
  • 55. Data visualization and dashboard -7.3. Table exercise.mp4
    01:42
  • 56. Data visualization and dashboard -7.4. Top 10 customers exercise.mp4
    01:38
  • 57. Data visualization and dashboard -7.5. Map exercise.mp4
    01:25
  • 58. Data visualization and dashboard -7.6. Slicers exercise.mp4
    05:47
  • 1. Quick start with Power BI-1.1. Introduction to Power BI.mp4
    07:44
  • 2. Quick start with Power BI-1.2. Interface & Getting data.mp4
    05:44
  • 3. Quick start with Power BI-1.3. My first column chart.mp4
    08:10
  • 4. Quick start with Power BI-1.4. Hierarchy on a chart.mp4
    08:05
  • 5. Quick start with Power BI-1.5. Hierarchy in the data model.mp4
    02:29
  • 6. Quick start with Power BI-1.6. Grouping data.mp4
    05:59
  • 7.1 1.7. dyi column chart.zip
  • 7. Quick start with Power BI-1.7. DIY Column chart.mp4
    03:15
  • 8. Quick start with Power BI-1.8. Matrix = Pivot table.mp4
    07:12
  • 9.1 1.9. diy matrix.zip
  • 9. Quick start with Power BI-1.9. DIY Matrix.mp4
    02:38
  • 10. Quick start with Power BI-1.10. Table = Pivot table.mp4
    04:13
  • 11. Quick start with Power BI-1.11. Line chart & Analytics.mp4
    05:09
  • 12. Quick start with Power BI-1.12. Explain the increase decrease.mp4
    05:34
  • 13.1 1.13. diy line chart.zip
  • 13. Quick start with Power BI-1.13. DIY Line chart.mp4
    03:22
  • 14. Quick start with Power BI-1.14. Waterfall, Funnel chart, Treemap.mp4
    03:20
  • 15. Quick start with Power BI-1.15. Q&A.mp4
    07:21
  • 16. Quick start with Power BI-1.16. DIY Q&A.mp4
    01:22
  • 17. Quick start with Power BI-1.17. Scatter chart & Zoom slider.mp4
    03:04
  • 18. Quick start with Power BI-1.18. Maps.mp4
    04:32
  • 19.1 1.9. diy matrix.zip
  • 19. Quick start with Power BI-1.19. DIY Maps.mp4
    00:55
  • 20. Quick start with Power BI-1.20. Chart interactions.mp4
    08:36
  • 21. Quick start with Power BI-Quick start with Power BI-1.21. Slicers.mp4
    04:36
  • 22. Quick start with Power BI-1.22. Slicers options.mp4
    08:48
  • 23. Quick start with Power BI-1.23. Publishing the report to Power BI Online.mp4
    05:22
  • 24.1 1.24. DYI Repetition.pptx
  • 24.2 sales.xlsx
  • 24. Quick start with Power BI-1.24. DYI Repetition.mp4
    14:54
  • 25. Quick start with Power BI-2.1. DIY Test your skillsData Visualization Basics.mp4
    00:46
  • 26. Quick start with Power BI-2.2. Data viz rules.mp4
    08:07
  • 27. Quick start with Power BI-2.3. DIY Exercise 1.mp4
    03:30
  • 28. Quick start with Power BI-2.4. DIY Exercise 2.mp4
    01:17
  • 29. Quick start with Power BI-2.5. DIY Exercise 3.mp4
    01:45
  • 30. Quick start with Power BI-2.6. DIY Exercise 4.mp4
    03:08
  • 31. Quick start with Power BI-2.7. DIY Exercise 5.mp4
    02:22
  • 32. Quick start with Power BI-2.8. DIY Exercise 6.mp4
    01:39
  • 33.1 Test.docx
  • 33.2 test.zip
  • 33.3 Test.xlsx
  • 33. Quick start with Power BI-2.9. DIY Exercise 7.mp4
    02:33
  • 34. Quick start with Power BI-3.1. Creating a data model.mp4
    04:52
  • 35. Quick start with Power BI-3.2. Defining measures.mp4
    03:58
  • 36. Quick start with Power BI-3.3. Gauge.mp4
    03:36
  • 37. Quick start with Power BI-3.4. Conditional formatting.mp4
    03:46
  • 38. Quick start with Power BI-3.5. KPI chart.mp4
    02:46
  • 39. Quick start with Power BI-3.6. Sorting by column.mp4
    01:57
  • 40. Quick start with Power BI-3.7. URL image.mp4
    02:13
  • 41. Quick start with Power BI-3.8. Quick measures YTD.mp4
    01:47
  • 42. Quick start with Power BI-3.9. Quick measures YoY % change.mp4
    01:03
  • 43. Data model-3.10. Quick measures Average per category.mp4
    01:59
  • 44. Quick start with Power BI-3.11. Quick measures Filtered value.mp4
    01:54
  • 45.1 data model.zip
  • 45.2 diy quick measures.zip
  • 45.3 region.xlsx
  • 45.4 sales.xlsx
  • 45.5 targets.xlsx
  • 45. Quick start with Power BI-3.12. DIY Quick measures.mp4
    02:03
  • 46.1 advanced & ai charts.zip
  • 46.2 Hans Rosling.pptx
  • 46.3 population 1960-2050.csv
  • 46.4 Rosling.xlsx
  • 46. Data model-Advanced & AI charts-4.1. Hans Roslings chart.mp4
    03:29
  • 47.1 advanced & ai charts.zip
  • 47.2 power bi animations.zip
  • 47. Quick start with Power BI-4.2. Animated charts.mp4
    02:13
  • 48. Quick start with Power BI-4.3. Small multiples.mp4
    02:06
  • 49. Quick start with Power BI-4.4. Histogram.mp4
    02:32
  • 50. Quick start with Power BI-4.5. Ribbon chart.mp4
    00:40
  • 51. Quick start with Power BI-4.6. Clusters.mp4
    02:28
  • 52. Quick start with Power BI-4.7. Dot plot.mp4
    01:47
  • 53. Quick start with Power BI-4.8. Explain distribution.mp4
    01:58
  • 54. Quick start with Power BI-4.9. Decomposition tree.mp4
    03:40
  • Description


    POWER course bundle for every Excel user & Power BI developer - Start a new life with Power tools

    What You'll Learn?


    • You will save working hours by automating reporting (Power Query),
    • You will improve the quality of data by catching errors (Power Query)
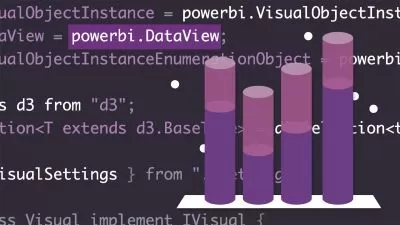
    • You will build transparent data models with KPIs (Power Pivot / Power BI),
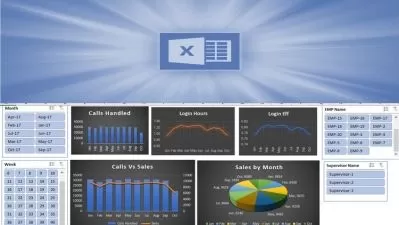
    • You will develop intuitive and interactive dashboards (Excel / Power BI).

    Who is this for?


  • The course is intended for Excel users who want to automate their work with data and create attractive, interactive dashboards.
  • Actually every Excel user should know Power Query which replaced in my places programming with VBA
  • It is intended for people becoming a Power BI Developer
  • More details


    Description

    Hi, I'm Bartosz - your Power Excel & Power BI Trainer from Excel BI Academy_com. If you already know Excel formulas & pivot tables, you are ready to start a new journey with me with tools like Power Query, Power Pivot (aka Data model & DAX), Excel Dashboards & Power BI Dashboards.

    Learning the POWER add-ins in Excel and Power BI will allow you to make significant changes in the reporting processes:

    • you will save working hours by automating reporting (Power Query),

    • you will improve the quality of data by catching errors (Power Query),

    • you will build transparent data models with KPIs (Power Pivot / Power BI),

    • you will develop intuitive and interactive dashboards (Excel / Power BI).

    Thanks to the courses, I have helped thousands of people change their reports and careers . Anyone who invests in this course has a chance to:

    • making better business decisions,

    • gain recognition and self-confidence,

    • get promoted or get a better paid job,

    • plan and pursue your professional career better.

    BEGIN A NEW STAGE IN YOUR LIFE

    9 out of 10 Excel users have not heard of them at all, so after the courses you have a great chance to become the king of reporting and an agent of changes in your organization.

    WHY IS IT WORTH BUYING 4IN1 POWER COURSES BUNDLE?

    • The practical nature of the courses – exercises only – based on the experiences of hundreds of participants of our training courses

    • 14 hours of learning material

    • Opportunity to ask questions on a regular basis

    • The scope of material constantly updated (with changes in tools)

    Who this course is for:

    • The course is intended for Excel users who want to automate their work with data and create attractive, interactive dashboards.
    • Actually every Excel user should know Power Query which replaced in my places programming with VBA
    • It is intended for people becoming a Power BI Developer

    User Reviews
    Rating
    0
    0
    0
    0
    0
    average 0
    Total votes0
    Focused display
    Bartosz Czapiewski
    Bartosz Czapiewski
    Instructor's Courses
    My name is Bartosz Czapiewski.I come from Poland and live in Warsaw. I teach Excel every day, namely:- Data visualization and dashboard design- Power Query, Power Pivot, Power BISince 2010 I run trainings in Polish and English, many of which are Fortune 500 companies, like Coca-Cola, 3M, BMW, Danone. At Excel BI Academy I gathered all my knowledge and expierence from +100 live trainings on:- Power Query for Excel & Power BI- Power Pivot aka Data model & DAX language- Power BI- Data Visualization & Dashboard designFrom 2020, my courses are available online.What's my motto?Effective Reports = Automation + Visualization and Analysis + Good DecisionEnglish term Effective Reports (SkuteczneRaporty in Polish) has become my company name.Where did my interest in dashboards come from?It was 2009 when, while working as an analyst in an international company from the financial industry, I was asked by my supervisor to prepare a “dashboard”. The word sounded strange to me, so I checked it thoroughly in a search engine, where I found car dashboards and analogous dashboards showing business results. Both forms had two important features – they fit on one screen within the sight of the recipient and present numbers in a graphic and visual form. It was a completely different approach than the one I had known before. Traditional reports, most common in companies and organizations, contain thousands of columns of numbers spread over multiple sheets. While looking for the best dashboard building practices, I came across the principles of data visualization, i.e. an approach that starts with how the human brain works in the context of data analysis. Only by combining these two elements – correct data visualization and dashboards, we make working with reports much easier.Why do I think this is important?Every day, millions of people around the world create reports in the form of text, tables, charts and graphics, the purpose of which is to convey information and share knowledge to the recipient. Reports are both a compilation of business data, a financial report or a press article. We are an information society where the ability to collect, process, analyze and present information is extremely valuable. Especially in business, reports are worth their weight in gold as they are the basis for making everyday decisions. Their accuracy largely depends on the effectiveness of the report. Here are my insights on data visualization:Most of the people who create charts cannot handle them properly.The most popular charts (e.g. pie charts) are among the least effective.It is fashionable to “colorize” reports that is contrary to the work of the brain.The most popular computer programs that are used to visualize data, including Microsoft Excel, mislead the user and violate the basic principles of data visualization.The charts that appear in the press and reports also mislead the public.The concept of dashboards was reflected only in Excel 2013, in a way so camouflaged that few users will discover it.Data visualization is not a subject that is taught at any economic university in Poland, nor is it included in MBA programs.
    Students take courses primarily to improve job-related skills.Some courses generate credit toward technical certification. Udemy has made a special effort to attract corporate trainers seeking to create coursework for employees of their company.
    • language english
    • Training sessions 182
    • duration 13:08:51
    • Release Date 2022/12/13