Companies Home Search Profile

Power BI Data Visualization and Dashboard Tips, Tricks, & Techniques

Focused View

Emma Saunders

1:59:28

243 View
  • 01 - Data visualization and reporting in Power BI.mp4
    00:17
  • 02 - Who this course is for.mp4
    00:55
  • 03 - What is Power BI.mp4
    01:44
  • 01 - Power BI Desktop and service.mp4
    03:47
  • 02 - Power BI licensing and trial account.mp4
    00:45
  • 03 - Use a sample report to learn Power BI navigation.mp4
    05:33
  • 04 - What your users can do with a report.mp4
    12:18
  • 01 - Edit mode in Power BI service.mp4
    15:50
  • 02 - Create a bar chart from a dataset.mp4
    09:23
  • 03 - Filter data for line and area charts.mp4
    05:42
  • 04 - Show single numbers with KPIs, cards, and gauges.mp4
    05:52
  • 05 - Proportion data with pies and treemaps.mp4
    05:39
  • 01 - Distribution analysis with scatterplot and histogram.mp4
    09:46
  • 02 - Challenge Find and download a boxplot.mp4
    00:17
  • 03 - Solution Find and download a boxplot.mp4
    01:32
  • 04 - Explore data with process and segment analysis.mp4
    06:40
  • 05 - Make a map or filled map for geographic data.mp4
    06:50
  • 06 - Challenge Visualize flight paths.mp4
    00:13
  • 07 - Solution Visualize flight paths.mp4
    01:07
  • 08 - Explore data with a table, matrix, slicer, Q&A.mp4
    06:42
  • 01 - When to make a new tab.mp4
    05:53
  • 02 - How to lay out your report page for maximum effect.mp4
    03:05
  • 03 - Use themes to change multiple colors or fonts.mp4
    05:12
  • 04 - Use color and fonts well.mp4
    04:08
  • 01 - Next steps.mp4
    00:18
  • Description


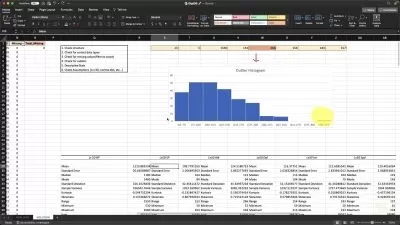
    Power BI is a software that lets users visualize and report data flexibly and share it in a number of ways. It is rapidly gaining market share, as it is affordable and well-integrated with other Microsoft tools. In this course, instructor Emma Saunders shows you how you can use Power BI to create reports and visualizations with flair and share them easily with colleagues. Emma explains the Power BI app (desktop) and service (web browser). She takes you through a sample report to show how it’s built, then goes over how and why to design and structure a report, including how to structure tabs, how many visuals to put on a page, and how to draw attention to one visual over another. Emma covers more advanced visuals, as well, including statistical diagrams and maps for geographic data. She walks you through how to design reports like a pro in the Power BI service, from basic layouts to choosing specific themes and fonts.

    More details


    User Reviews
    Rating
    0
    0
    0
    0
    0
    average 0
    Total votes0
    Focused display
    Emma Saunders
    Emma Saunders
    Instructor's Courses
    Data visualisations, training & consultancy. D3.js, Power BI custom visuals, js-based web apps. Design and delivery. Online courses at LinkedIn Learning.
    LinkedIn Learning is an American online learning provider. It provides video courses taught by industry experts in software, creative, and business skills. It is a subsidiary of LinkedIn. All the courses on LinkedIn fall into four categories: Business, Creative, Technology and Certifications. It was founded in 1995 by Lynda Weinman as Lynda.com before being acquired by LinkedIn in 2015. Microsoft acquired LinkedIn in December 2016.
    • language english
    • Training sessions 25
    • duration 1:59:28
    • Release Date 2023/01/05