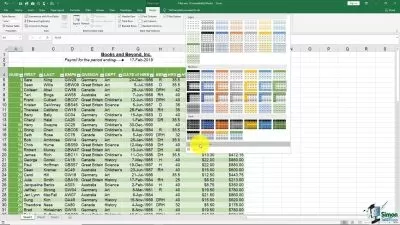
MS Excel Pivot tables & Charts for Beginners
Raghvan Bhattacharya
2:06:51
Description
Learn how to use Pivot tables for creating reports.
What You'll Learn?
- Charts
- Pivots
- How to Create Pivots
- Create Reports From Pivots
Who is this for?
What You Need to Know?
More details
DescriptionWHO'S THIS FOR?
This course is designed specifically for Beginners.
MS Excel
Excel is flexible and versatile tool for data analysis, data cleaning and data visualization. It is up to person imagination and creativity to capture utilization potential of Excel can offer. Flexibility means you can represent or format data as per your need and can do same task in more than one way.
Advantages of Excel
Excel helps to analyze data. Today companies have large data. It becomes easy to analyze and interpret large with the help of excel.
It helps to know the trend in the data with the help of charts, graphs, 3-D images, etc.
Excel helps in bringing data together. It is possible to import files and documents in excel.
We can work with others simultaneously with the help of an excel web app.
It helps to store data, do calculations, organize, and format the cells.
Excel file is secured with a password, therefore, security is assured.
Disadvantages of Excel
Can't handle large amounts of data.
File hanging, Corrupting issue if size is large.
Excel becomes slow or crashes when you have lots of data, formatting and Charts inside a workbook.
My Opinion on Excel
Excel will always be a heart of organization. we have Tableau, Power BI tools which are becoming the backbone of Industry but Excel will always be a Part of the the industry. we can't ignore it.
COURSE STRUCTURE
Excel Charts
Pivots Tables
Reports
Pivot Charts
Who this course is for:
- Freshers or Absolute Beginners
WHO'S THIS FOR?
This course is designed specifically for Beginners.
MS Excel
Excel is flexible and versatile tool for data analysis, data cleaning and data visualization. It is up to person imagination and creativity to capture utilization potential of Excel can offer. Flexibility means you can represent or format data as per your need and can do same task in more than one way.
Advantages of Excel
Excel helps to analyze data. Today companies have large data. It becomes easy to analyze and interpret large with the help of excel.
It helps to know the trend in the data with the help of charts, graphs, 3-D images, etc.
Excel helps in bringing data together. It is possible to import files and documents in excel.
We can work with others simultaneously with the help of an excel web app.
It helps to store data, do calculations, organize, and format the cells.
Excel file is secured with a password, therefore, security is assured.
Disadvantages of Excel
Can't handle large amounts of data.
File hanging, Corrupting issue if size is large.
Excel becomes slow or crashes when you have lots of data, formatting and Charts inside a workbook.
My Opinion on Excel
Excel will always be a heart of organization. we have Tableau, Power BI tools which are becoming the backbone of Industry but Excel will always be a Part of the the industry. we can't ignore it.
COURSE STRUCTURE
Excel Charts
Pivots Tables
Reports
Pivot Charts
Who this course is for:
- Freshers or Absolute Beginners
User Reviews
Rating
Raghvan Bhattacharya
Instructor's Courses
Udemy
View courses Udemy- language english
- Training sessions 7
- duration 2:06:51
- English subtitles has
- Release Date 2022/11/20


