Microsoft Excel Engineering Interactive Dashboards
Manish Narayan
51:21
Description
Spreadsheet Engineering
What You'll Learn?
- Transform Excel into an engineering tool that will help solve real world problems in various industries
- Gain knowledge in Excel and Visual Basic for Applications (VBA)
- Create Structured Spreadsheet Designs
- Develop VBA Functions and Sub Procedures
- Expand the role of spreadsheets to improve processes
- Utilize Excel Engineering for Optimization and Uncertainty Analysis
- Introduce UserForms and User Controls for overall Project Control
Who is this for?
What You Need to Know?
More details
DescriptionTransform Microsoft Excel into a Spreadsheet Engineering environment!
Are you a student or professional in the field of engineering, finance, management, or science and have not been able to utilize Excel to its fullest potential to setup, model and solve real-world problems? Don't worry as THIS IS THE COURSE FOR YOU!Â
Microsoft Excel is everywhere, at your home, university campus, or even at the workplace, but most users only utilize the basic functionality, rely on unstructured worksheets, and forget about the powerful tools that Excel is built upon.
In my course, I will teach you how to transform Excel into a spreadsheet engineering environment making use of structured worksheet designs, Visual Basic for Applications ("VBA"), complex spreadsheet function combinations, and best practices that will not only make your life easier when dealing with information/data but allow you to tackle those real-world problems whether at home, school, or in the professional field.
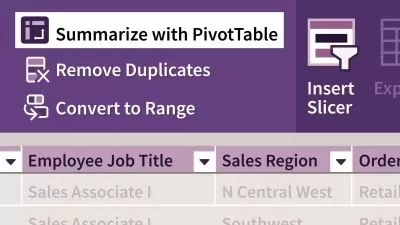
Interactive Dashboards will allow you to design and present real-world reporting dashboards by bringing your data to life! Interactive controls allow clients and users of your dashboard to easily slice and filter data through custom controls.
Take this course and show the world your transition from Excel User to Excel Engineer!Â
Who this course is for:
- Students, Adults, Professionals, Educators
Transform Microsoft Excel into a Spreadsheet Engineering environment!
Are you a student or professional in the field of engineering, finance, management, or science and have not been able to utilize Excel to its fullest potential to setup, model and solve real-world problems? Don't worry as THIS IS THE COURSE FOR YOU!Â
Microsoft Excel is everywhere, at your home, university campus, or even at the workplace, but most users only utilize the basic functionality, rely on unstructured worksheets, and forget about the powerful tools that Excel is built upon.
In my course, I will teach you how to transform Excel into a spreadsheet engineering environment making use of structured worksheet designs, Visual Basic for Applications ("VBA"), complex spreadsheet function combinations, and best practices that will not only make your life easier when dealing with information/data but allow you to tackle those real-world problems whether at home, school, or in the professional field.
Interactive Dashboards will allow you to design and present real-world reporting dashboards by bringing your data to life! Interactive controls allow clients and users of your dashboard to easily slice and filter data through custom controls.
Take this course and show the world your transition from Excel User to Excel Engineer!Â
Who this course is for:
- Students, Adults, Professionals, Educators
User Reviews
Rating
Manish Narayan
Instructor's Courses
Udemy
View courses Udemy- language english
- Training sessions 10
- duration 51:21
- English subtitles has
- Release Date 2024/03/13


