Microsoft Excel- Create Dashboards and Master Power Query
Amit Marmari
3:11:47
Description
Master Excel's most useful formulas and create your own dashboard using Power Query - from scratch!
What You'll Learn?
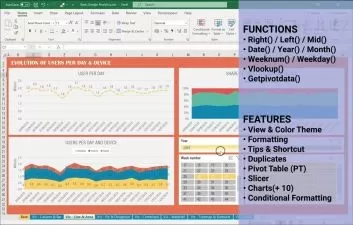
- Learn how to create dashboard from scratch
- Mastering Microsoft Excel fundamentals
- Get to know Excel's basic formulas
- Mastering Pivot Tables and Charts
- Mastering Power Query and get to know the tool - as it also useful for Power BI
Who is this for?
More details
DescriptionIf you are looking for the best place to learn Excel's basics and upgrade your skills - this is the course for YOU!
This course is designed to provide students with comprehensive training on how to create professional-looking dashboards in Excel. With over 3 hours of content, this course is packed with valuable information that is available to students forever.
In those 3 hours, students will learn how to create dashboards from scratch, and how to master advanced features such as Pivot tables and charts. These features are essential for creating dynamic and interactive reports, and will give students the ability to analyze and present data in a clear and meaningful way.
In addition to learning about these advanced features, students will also learn about Excel formulas. These formulas are the backbone of Excel and are essential for automating calculations and analyzing data. We will cover a wide range of formulas, from basic arithmetic to more advanced functions, and will provide students with the knowledge they need to take their Excel skills to the next level.
Overall, this Excel online course is perfect for beginners who are looking to become proficient in Excel, as well as more advanced users who want to take their skills to the next level. With a focus on creating professional-looking dashboards and mastering advanced features, this course will provide students with the knowledge they need to succeed in the world of data analysis and reporting.
Additionally, there is a 30-day return policy, ensuring that students are completely satisfied with their learning experience.
Come join us and start your journey today!
P.S. - I want to thank Danielle Harosh for editing this course. You are amazing.
Also, this course is dedicated to my late friends, Eytam Magini and Tomer Morad. I miss you guys.
Who this course is for:
- Microsoft Excel users
- Dashboard builders - beginners to pros
- Power BI users
If you are looking for the best place to learn Excel's basics and upgrade your skills - this is the course for YOU!
This course is designed to provide students with comprehensive training on how to create professional-looking dashboards in Excel. With over 3 hours of content, this course is packed with valuable information that is available to students forever.
In those 3 hours, students will learn how to create dashboards from scratch, and how to master advanced features such as Pivot tables and charts. These features are essential for creating dynamic and interactive reports, and will give students the ability to analyze and present data in a clear and meaningful way.
In addition to learning about these advanced features, students will also learn about Excel formulas. These formulas are the backbone of Excel and are essential for automating calculations and analyzing data. We will cover a wide range of formulas, from basic arithmetic to more advanced functions, and will provide students with the knowledge they need to take their Excel skills to the next level.
Overall, this Excel online course is perfect for beginners who are looking to become proficient in Excel, as well as more advanced users who want to take their skills to the next level. With a focus on creating professional-looking dashboards and mastering advanced features, this course will provide students with the knowledge they need to succeed in the world of data analysis and reporting.
Additionally, there is a 30-day return policy, ensuring that students are completely satisfied with their learning experience.
Come join us and start your journey today!
P.S. - I want to thank Danielle Harosh for editing this course. You are amazing.
Also, this course is dedicated to my late friends, Eytam Magini and Tomer Morad. I miss you guys.
Who this course is for:
- Microsoft Excel users
- Dashboard builders - beginners to pros
- Power BI users
User Reviews
Rating

Amit Marmari
Instructor's Courses
Udemy
View courses Udemy- language english
- Training sessions 60
- duration 3:11:47
- Release Date 2023/03/09