Mastering Excel Data Visualization: Static Charts & Graphs
DataRiel Academy
3:05:12
Description
Master 22+ Excel charts/graphs from A to Z with hand-on demos exercises (Excel 2016, 2019, 2021, Microsoft 365/online)
What You'll Learn?
- Understand of USES and BEST PRACTICES of 22+ charts in Excel 2019+ (or Microsoft 365)
- Master powerful practical tips and tools to better communicate and concise message through your Excel charts
- Build 22+ Excel real-world projects from scratch to help you become a data viz rockstar.
- Learn how to make eye-catching Excel charts and better visualization through advanced customization techniques like adding titles, axes, data labels
Who is this for?
More details
DescriptionData visualization transfers data into insight through charts or graphs. It makes it easier to identify trends and patterns instead of looking at large data sets in a spreadsheet/tabular.
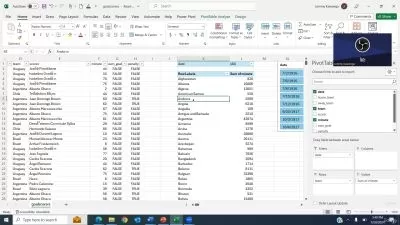
When it comes to visualization tools, Excel offers a significant number of built-in charts for its ease of use and flexibility. Anyone with access to that spreadsheet can create various types of charts/graphs in a meaningful way. Excel allows users to generate a chart in just a few clicks and enable them to customize that chart easily such as adding titles, axes, labels, colors, etc.
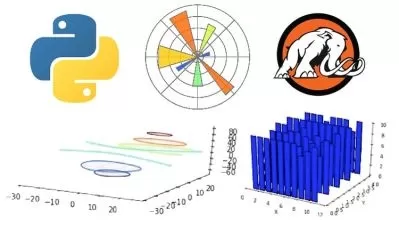
This course provides you with a laser-focused, 100% comprehensive understanding of the latest Excel visualization tools. I’ll help you take all of the basic Excel visualization techniques and apply them in real-world applications. From there, we’ll explore over 22 different chart types available in Excel 2019(version 2016 and Microsoft 365 are also available) such as:
Column chart
Bar chart
Line chart
Pie chart
Waterfall chart
Candlestick chart
Area chart
Scatter plot
Bubble chart
Treemap chart
Sunburst chart
Radar chart
Lollipop chart
Dumbbell chart
Box & Whisker plot
Histogram
Pareto chart
Funnel chart
Sparkline chart
Heatmap chart
3-D surface chart
Contour chart
Tornado chart
Combo chart
And more…
In each lesson, you’ll begin with a solid knowledge of the uses and best practices of a chart, course expectations, and steps-by-steps instruction through interactive hands-on demos and exercises. To guarantee you get a 100% understanding of the course, I’ve included course handouts of all chart types in the tutorial to walk you through every single step from start to finish. You can’t find these demos material elsewhere, except in this course.
What you’ll get from this course:
Full lifetime access to all course demos
22+ charts step-by-step instruction documents
22+ Excel exercise files
Yearly course update (I’ll add new chart types and techniques every year)
Certificate of completion
And more…
Let’s dive together to Master Excel Data Visualization: Static Charts & Graphs.
Cheers,
-Datariel (BI Analytics Training Center)
--------------------------
Update History:
-November 15, 2022: officially launched the course.
Who this course is for:
- Anyone who wants to learn how to create effective and beautiful charts/graphs in Excel.
- Excel users who want to expand their portfolio and experiences to impress their employers.
- Professionals who are looking to explore more about data analytics and visual presentation in Excel.
- Students who want to master data visualization skills with Excel.
- Learners who are looking to find best Excel chart course with hands-on demo exercise files and support documents.
Data visualization transfers data into insight through charts or graphs. It makes it easier to identify trends and patterns instead of looking at large data sets in a spreadsheet/tabular.
When it comes to visualization tools, Excel offers a significant number of built-in charts for its ease of use and flexibility. Anyone with access to that spreadsheet can create various types of charts/graphs in a meaningful way. Excel allows users to generate a chart in just a few clicks and enable them to customize that chart easily such as adding titles, axes, labels, colors, etc.
This course provides you with a laser-focused, 100% comprehensive understanding of the latest Excel visualization tools. I’ll help you take all of the basic Excel visualization techniques and apply them in real-world applications. From there, we’ll explore over 22 different chart types available in Excel 2019(version 2016 and Microsoft 365 are also available) such as:
Column chart
Bar chart
Line chart
Pie chart
Waterfall chart
Candlestick chart
Area chart
Scatter plot
Bubble chart
Treemap chart
Sunburst chart
Radar chart
Lollipop chart
Dumbbell chart
Box & Whisker plot
Histogram
Pareto chart
Funnel chart
Sparkline chart
Heatmap chart
3-D surface chart
Contour chart
Tornado chart
Combo chart
And more…
In each lesson, you’ll begin with a solid knowledge of the uses and best practices of a chart, course expectations, and steps-by-steps instruction through interactive hands-on demos and exercises. To guarantee you get a 100% understanding of the course, I’ve included course handouts of all chart types in the tutorial to walk you through every single step from start to finish. You can’t find these demos material elsewhere, except in this course.
What you’ll get from this course:
Full lifetime access to all course demos
22+ charts step-by-step instruction documents
22+ Excel exercise files
Yearly course update (I’ll add new chart types and techniques every year)
Certificate of completion
And more…
Let’s dive together to Master Excel Data Visualization: Static Charts & Graphs.
Cheers,
-Datariel (BI Analytics Training Center)
--------------------------
Update History:
-November 15, 2022: officially launched the course.
Who this course is for:
- Anyone who wants to learn how to create effective and beautiful charts/graphs in Excel.
- Excel users who want to expand their portfolio and experiences to impress their employers.
- Professionals who are looking to explore more about data analytics and visual presentation in Excel.
- Students who want to master data visualization skills with Excel.
- Learners who are looking to find best Excel chart course with hands-on demo exercise files and support documents.
User Reviews
Rating

DataRiel Academy
Instructor's Courses
Udemy
View courses Udemy- language english
- Training sessions 48
- duration 3:05:12
- Release Date 2022/12/24